Immigrants from Asia vs South African Median Male Earnings
COMPARE
Immigrants from Asia
South African
Median Male Earnings
Median Male Earnings Comparison
Immigrants from Asia
South Africans
$63,240
MEDIAN MALE EARNINGS
100.0/ 100
METRIC RATING
35th/ 347
METRIC RANK
$61,460
MEDIAN MALE EARNINGS
99.9/ 100
METRIC RATING
53rd/ 347
METRIC RANK
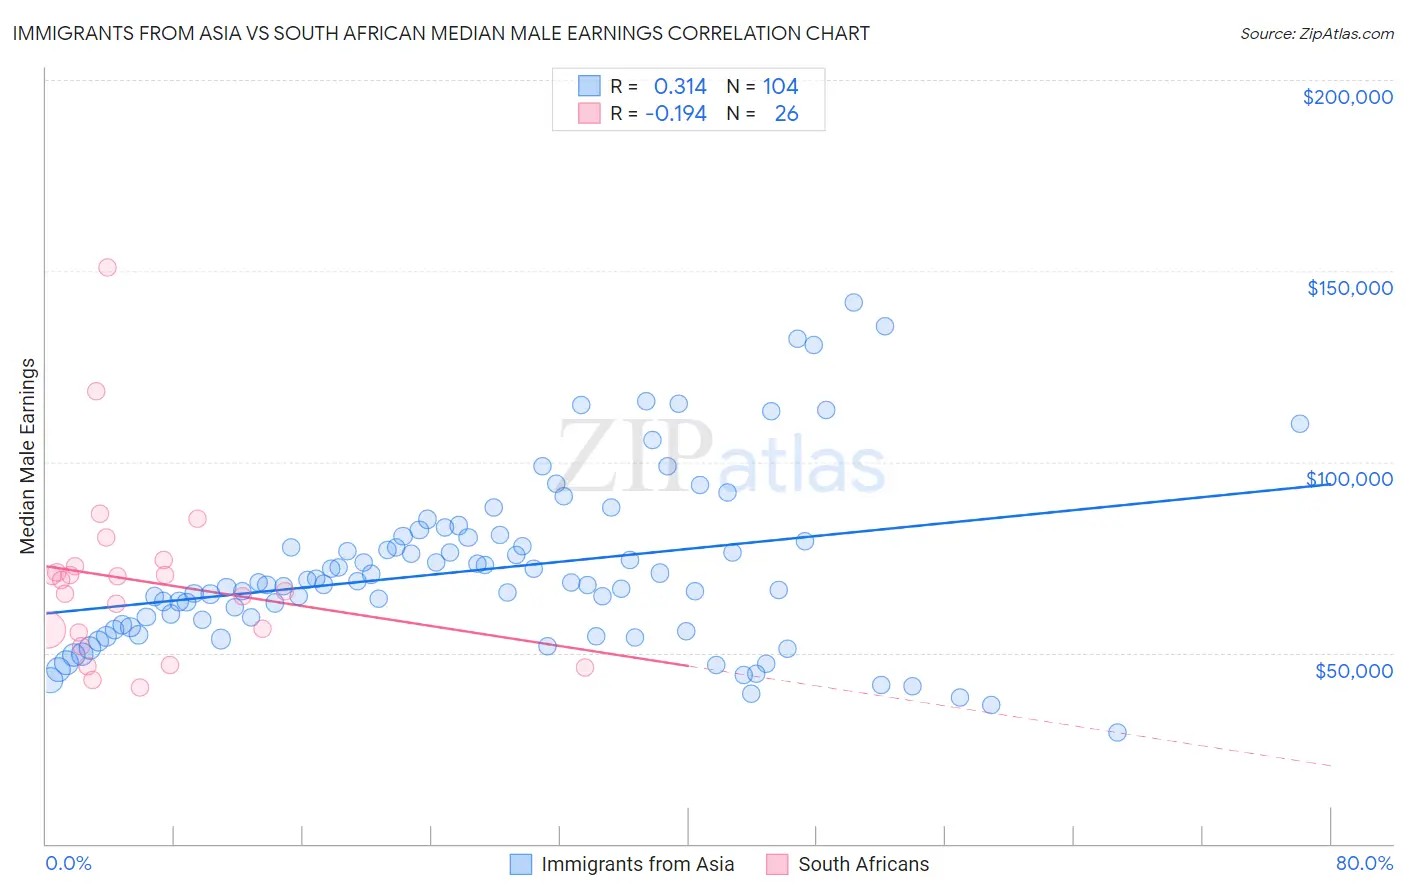
Immigrants from Asia vs South African Median Male Earnings Correlation Chart
The statistical analysis conducted on geographies consisting of 548,524,419 people shows a mild positive correlation between the proportion of Immigrants from Asia and median male earnings in the United States with a correlation coefficient (R) of 0.314 and weighted average of $63,240. Similarly, the statistical analysis conducted on geographies consisting of 182,591,048 people shows a poor negative correlation between the proportion of South Africans and median male earnings in the United States with a correlation coefficient (R) of -0.194 and weighted average of $61,460, a difference of 2.9%.
Median Male Earnings Correlation Summary
| Measurement | Immigrants from Asia | South African |
| Minimum | $29,236 | $40,972 |
| Maximum | $141,758 | $150,965 |
| Range | $112,522 | $109,993 |
| Mean | $71,617 | $68,892 |
| Median | $67,918 | $67,477 |
| Interquartile 25% (IQ1) | $56,355 | $55,347 |
| Interquartile 75% (IQ3) | $79,747 | $72,701 |
| Interquartile Range (IQR) | $23,393 | $17,354 |
| Standard Deviation (Sample) | $22,311 | $23,483 |
| Standard Deviation (Population) | $22,203 | $23,027 |
Demographics Similar to Immigrants from Asia and South Africans by Median Male Earnings
In terms of median male earnings, the demographic groups most similar to Immigrants from Asia are Israeli ($63,228, a difference of 0.020%), Immigrants from Russia ($63,326, a difference of 0.14%), Immigrants from Sri Lanka ($63,099, a difference of 0.22%), Maltese ($62,953, a difference of 0.46%), and Immigrants from South Africa ($62,899, a difference of 0.54%). Similarly, the demographic groups most similar to South Africans are Immigrants from Latvia ($61,422, a difference of 0.060%), Immigrants from Norway ($61,628, a difference of 0.27%), Estonian ($61,710, a difference of 0.41%), Bhutanese ($61,759, a difference of 0.49%), and Immigrants from Europe ($62,057, a difference of 0.97%).
| Demographics | Rating | Rank | Median Male Earnings |
| Immigrants | Russia | 100.0 /100 | #34 | Exceptional $63,326 |
| Immigrants | Asia | 100.0 /100 | #35 | Exceptional $63,240 |
| Israelis | 100.0 /100 | #36 | Exceptional $63,228 |
| Immigrants | Sri Lanka | 100.0 /100 | #37 | Exceptional $63,099 |
| Maltese | 100.0 /100 | #38 | Exceptional $62,953 |
| Immigrants | South Africa | 100.0 /100 | #39 | Exceptional $62,899 |
| Australians | 100.0 /100 | #40 | Exceptional $62,857 |
| Immigrants | Turkey | 100.0 /100 | #41 | Exceptional $62,728 |
| Immigrants | Greece | 100.0 /100 | #42 | Exceptional $62,689 |
| Immigrants | Belarus | 100.0 /100 | #43 | Exceptional $62,658 |
| Cambodians | 100.0 /100 | #44 | Exceptional $62,516 |
| Bulgarians | 100.0 /100 | #45 | Exceptional $62,378 |
| Immigrants | Czechoslovakia | 99.9 /100 | #46 | Exceptional $62,217 |
| Immigrants | Austria | 99.9 /100 | #47 | Exceptional $62,164 |
| Immigrants | Malaysia | 99.9 /100 | #48 | Exceptional $62,121 |
| Immigrants | Europe | 99.9 /100 | #49 | Exceptional $62,057 |
| Bhutanese | 99.9 /100 | #50 | Exceptional $61,759 |
| Estonians | 99.9 /100 | #51 | Exceptional $61,710 |
| Immigrants | Norway | 99.9 /100 | #52 | Exceptional $61,628 |
| South Africans | 99.9 /100 | #53 | Exceptional $61,460 |
| Immigrants | Latvia | 99.9 /100 | #54 | Exceptional $61,422 |