Immigrants from Malaysia vs South African Median Male Earnings
COMPARE
Immigrants from Malaysia
South African
Median Male Earnings
Median Male Earnings Comparison
Immigrants from Malaysia
South Africans
$62,121
MEDIAN MALE EARNINGS
99.9/ 100
METRIC RATING
48th/ 347
METRIC RANK
$61,460
MEDIAN MALE EARNINGS
99.9/ 100
METRIC RATING
53rd/ 347
METRIC RANK
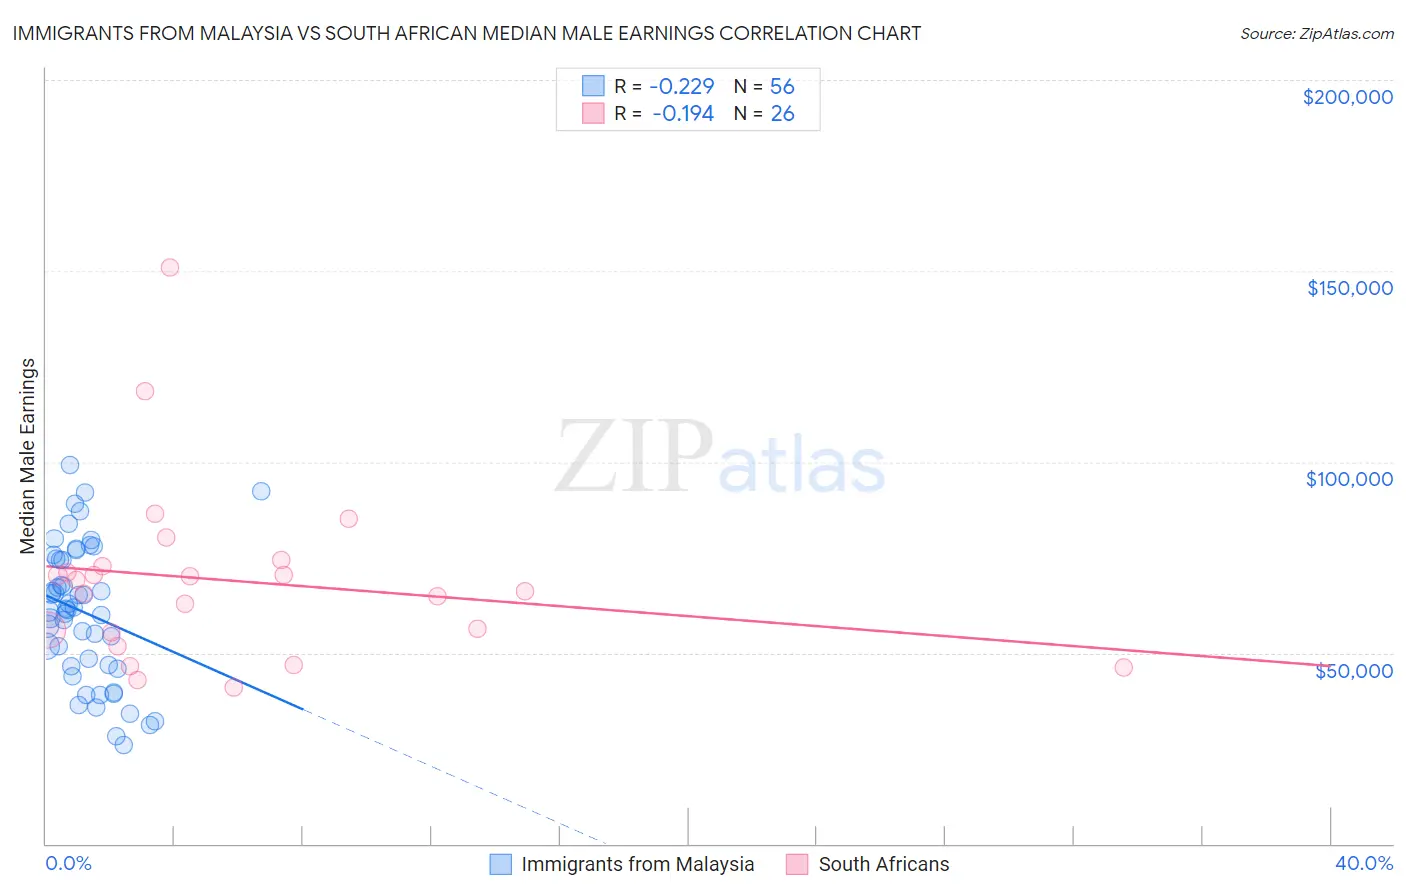
Immigrants from Malaysia vs South African Median Male Earnings Correlation Chart
The statistical analysis conducted on geographies consisting of 197,949,905 people shows a weak negative correlation between the proportion of Immigrants from Malaysia and median male earnings in the United States with a correlation coefficient (R) of -0.229 and weighted average of $62,121. Similarly, the statistical analysis conducted on geographies consisting of 182,591,048 people shows a poor negative correlation between the proportion of South Africans and median male earnings in the United States with a correlation coefficient (R) of -0.194 and weighted average of $61,460, a difference of 1.1%.
Median Male Earnings Correlation Summary
| Measurement | Immigrants from Malaysia | South African |
| Minimum | $25,921 | $40,972 |
| Maximum | $99,264 | $150,965 |
| Range | $73,343 | $109,993 |
| Mean | $60,570 | $68,892 |
| Median | $61,469 | $67,477 |
| Interquartile 25% (IQ1) | $46,765 | $55,347 |
| Interquartile 75% (IQ3) | $74,461 | $72,701 |
| Interquartile Range (IQR) | $27,696 | $17,354 |
| Standard Deviation (Sample) | $17,826 | $23,483 |
| Standard Deviation (Population) | $17,666 | $23,027 |
Demographics Similar to Immigrants from Malaysia and South Africans by Median Male Earnings
In terms of median male earnings, the demographic groups most similar to Immigrants from Malaysia are Immigrants from Austria ($62,164, a difference of 0.070%), Immigrants from Europe ($62,057, a difference of 0.10%), Immigrants from Czechoslovakia ($62,217, a difference of 0.15%), Bulgarian ($62,378, a difference of 0.41%), and Bhutanese ($61,759, a difference of 0.59%). Similarly, the demographic groups most similar to South Africans are Immigrants from Latvia ($61,422, a difference of 0.060%), Immigrants from Norway ($61,628, a difference of 0.27%), Greek ($61,242, a difference of 0.36%), Lithuanian ($61,228, a difference of 0.38%), and Immigrants from Scotland ($61,220, a difference of 0.39%).
| Demographics | Rating | Rank | Median Male Earnings |
| Australians | 100.0 /100 | #40 | Exceptional $62,857 |
| Immigrants | Turkey | 100.0 /100 | #41 | Exceptional $62,728 |
| Immigrants | Greece | 100.0 /100 | #42 | Exceptional $62,689 |
| Immigrants | Belarus | 100.0 /100 | #43 | Exceptional $62,658 |
| Cambodians | 100.0 /100 | #44 | Exceptional $62,516 |
| Bulgarians | 100.0 /100 | #45 | Exceptional $62,378 |
| Immigrants | Czechoslovakia | 99.9 /100 | #46 | Exceptional $62,217 |
| Immigrants | Austria | 99.9 /100 | #47 | Exceptional $62,164 |
| Immigrants | Malaysia | 99.9 /100 | #48 | Exceptional $62,121 |
| Immigrants | Europe | 99.9 /100 | #49 | Exceptional $62,057 |
| Bhutanese | 99.9 /100 | #50 | Exceptional $61,759 |
| Estonians | 99.9 /100 | #51 | Exceptional $61,710 |
| Immigrants | Norway | 99.9 /100 | #52 | Exceptional $61,628 |
| South Africans | 99.9 /100 | #53 | Exceptional $61,460 |
| Immigrants | Latvia | 99.9 /100 | #54 | Exceptional $61,422 |
| Greeks | 99.9 /100 | #55 | Exceptional $61,242 |
| Lithuanians | 99.9 /100 | #56 | Exceptional $61,228 |
| Immigrants | Scotland | 99.9 /100 | #57 | Exceptional $61,220 |
| New Zealanders | 99.9 /100 | #58 | Exceptional $61,199 |
| Immigrants | Netherlands | 99.8 /100 | #59 | Exceptional $61,096 |
| Egyptians | 99.8 /100 | #60 | Exceptional $61,095 |