Immigrants from Switzerland vs Immigrants from Italy Householder Income Over 65 years
COMPARE
Immigrants from Switzerland
Immigrants from Italy
Householder Income Over 65 years
Householder Income Over 65 years Comparison
Immigrants from Switzerland
Immigrants from Italy
$69,343
HOUSEHOLDER INCOME OVER 65 YEARS
100.0/ 100
METRIC RATING
27th/ 347
METRIC RANK
$64,065
HOUSEHOLDER INCOME OVER 65 YEARS
96.2/ 100
METRIC RATING
101st/ 347
METRIC RANK
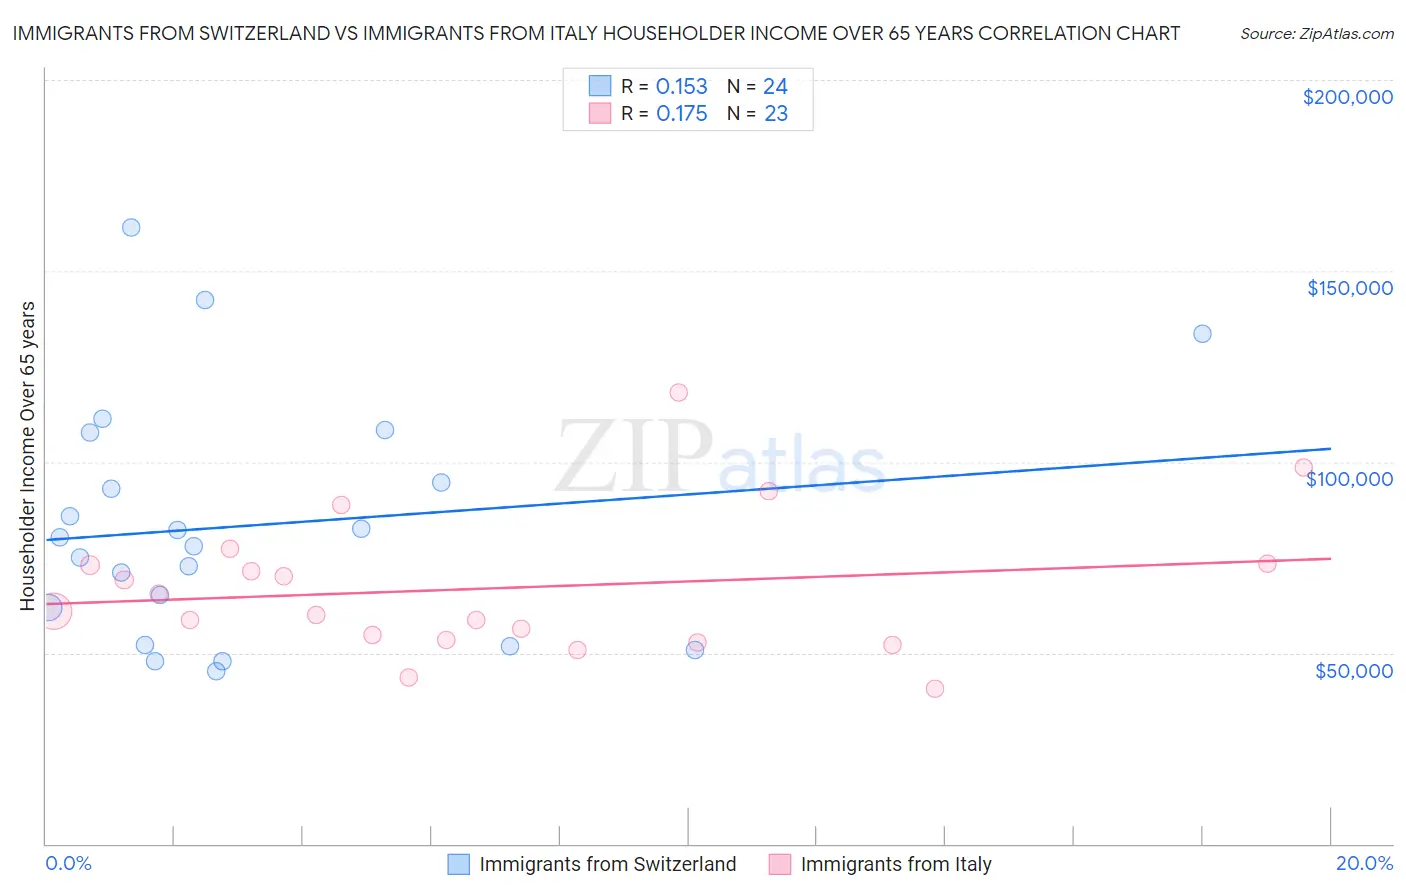
Immigrants from Switzerland vs Immigrants from Italy Householder Income Over 65 years Correlation Chart
The statistical analysis conducted on geographies consisting of 147,981,547 people shows a poor positive correlation between the proportion of Immigrants from Switzerland and household income with householder over the age of 65 in the United States with a correlation coefficient (R) of 0.153 and weighted average of $69,343. Similarly, the statistical analysis conducted on geographies consisting of 323,658,132 people shows a poor positive correlation between the proportion of Immigrants from Italy and household income with householder over the age of 65 in the United States with a correlation coefficient (R) of 0.175 and weighted average of $64,065, a difference of 8.2%.
Householder Income Over 65 years Correlation Summary
| Measurement | Immigrants from Switzerland | Immigrants from Italy |
| Minimum | $45,029 | $40,625 |
| Maximum | $161,506 | $118,263 |
| Range | $116,477 | $77,638 |
| Mean | $83,378 | $66,915 |
| Median | $79,119 | $60,782 |
| Interquartile 25% (IQ1) | $56,976 | $53,273 |
| Interquartile 75% (IQ3) | $101,163 | $73,333 |
| Interquartile Range (IQR) | $44,187 | $20,060 |
| Standard Deviation (Sample) | $31,315 | $18,554 |
| Standard Deviation (Population) | $30,656 | $18,146 |
Similar Demographics by Householder Income Over 65 years
Demographics Similar to Immigrants from Switzerland by Householder Income Over 65 years
In terms of householder income over 65 years, the demographic groups most similar to Immigrants from Switzerland are Immigrants from Sri Lanka ($69,426, a difference of 0.12%), Immigrants from China ($69,174, a difference of 0.25%), Immigrants from Australia ($69,164, a difference of 0.26%), Immigrants from Northern Europe ($69,003, a difference of 0.49%), and Immigrants from Belgium ($69,703, a difference of 0.52%).
| Demographics | Rating | Rank | Householder Income Over 65 years |
| Immigrants | South Central Asia | 100.0 /100 | #20 | Exceptional $70,103 |
| Immigrants | Eastern Asia | 100.0 /100 | #21 | Exceptional $69,872 |
| Immigrants | Israel | 100.0 /100 | #22 | Exceptional $69,857 |
| Immigrants | Japan | 100.0 /100 | #23 | Exceptional $69,774 |
| Immigrants | Sweden | 100.0 /100 | #24 | Exceptional $69,722 |
| Immigrants | Belgium | 100.0 /100 | #25 | Exceptional $69,703 |
| Immigrants | Sri Lanka | 100.0 /100 | #26 | Exceptional $69,426 |
| Immigrants | Switzerland | 100.0 /100 | #27 | Exceptional $69,343 |
| Immigrants | China | 100.0 /100 | #28 | Exceptional $69,174 |
| Immigrants | Australia | 100.0 /100 | #29 | Exceptional $69,164 |
| Immigrants | Northern Europe | 100.0 /100 | #30 | Exceptional $69,003 |
| Afghans | 100.0 /100 | #31 | Exceptional $68,951 |
| Asians | 100.0 /100 | #32 | Exceptional $68,822 |
| Immigrants | Denmark | 100.0 /100 | #33 | Exceptional $68,801 |
| Immigrants | Ireland | 100.0 /100 | #34 | Exceptional $68,495 |
Demographics Similar to Immigrants from Italy by Householder Income Over 65 years
In terms of householder income over 65 years, the demographic groups most similar to Immigrants from Italy are Immigrants from South Eastern Asia ($64,089, a difference of 0.040%), Assyrian/Chaldean/Syriac ($64,108, a difference of 0.070%), Romanian ($64,142, a difference of 0.12%), Chilean ($63,957, a difference of 0.17%), and British ($63,940, a difference of 0.20%).
| Demographics | Rating | Rank | Householder Income Over 65 years |
| Immigrants | Egypt | 97.0 /100 | #94 | Exceptional $64,299 |
| Immigrants | Latvia | 97.0 /100 | #95 | Exceptional $64,298 |
| Immigrants | Hungary | 97.0 /100 | #96 | Exceptional $64,277 |
| Sri Lankans | 96.7 /100 | #97 | Exceptional $64,201 |
| Romanians | 96.5 /100 | #98 | Exceptional $64,142 |
| Assyrians/Chaldeans/Syriacs | 96.4 /100 | #99 | Exceptional $64,108 |
| Immigrants | South Eastern Asia | 96.3 /100 | #100 | Exceptional $64,089 |
| Immigrants | Italy | 96.2 /100 | #101 | Exceptional $64,065 |
| Chileans | 95.8 /100 | #102 | Exceptional $63,957 |
| British | 95.7 /100 | #103 | Exceptional $63,940 |
| Immigrants | Cameroon | 95.6 /100 | #104 | Exceptional $63,907 |
| Italians | 95.5 /100 | #105 | Exceptional $63,885 |
| Immigrants | Argentina | 95.5 /100 | #106 | Exceptional $63,885 |
| Pakistanis | 95.3 /100 | #107 | Exceptional $63,844 |
| Palestinians | 95.1 /100 | #108 | Exceptional $63,800 |