Immigrants from Caribbean vs Immigrants from Italy Householder Income Over 65 years
COMPARE
Immigrants from Caribbean
Immigrants from Italy
Householder Income Over 65 years
Householder Income Over 65 years Comparison
Immigrants from Caribbean
Immigrants from Italy
$48,535
HOUSEHOLDER INCOME OVER 65 YEARS
0.0/ 100
METRIC RATING
338th/ 347
METRIC RANK
$64,065
HOUSEHOLDER INCOME OVER 65 YEARS
96.2/ 100
METRIC RATING
101st/ 347
METRIC RANK
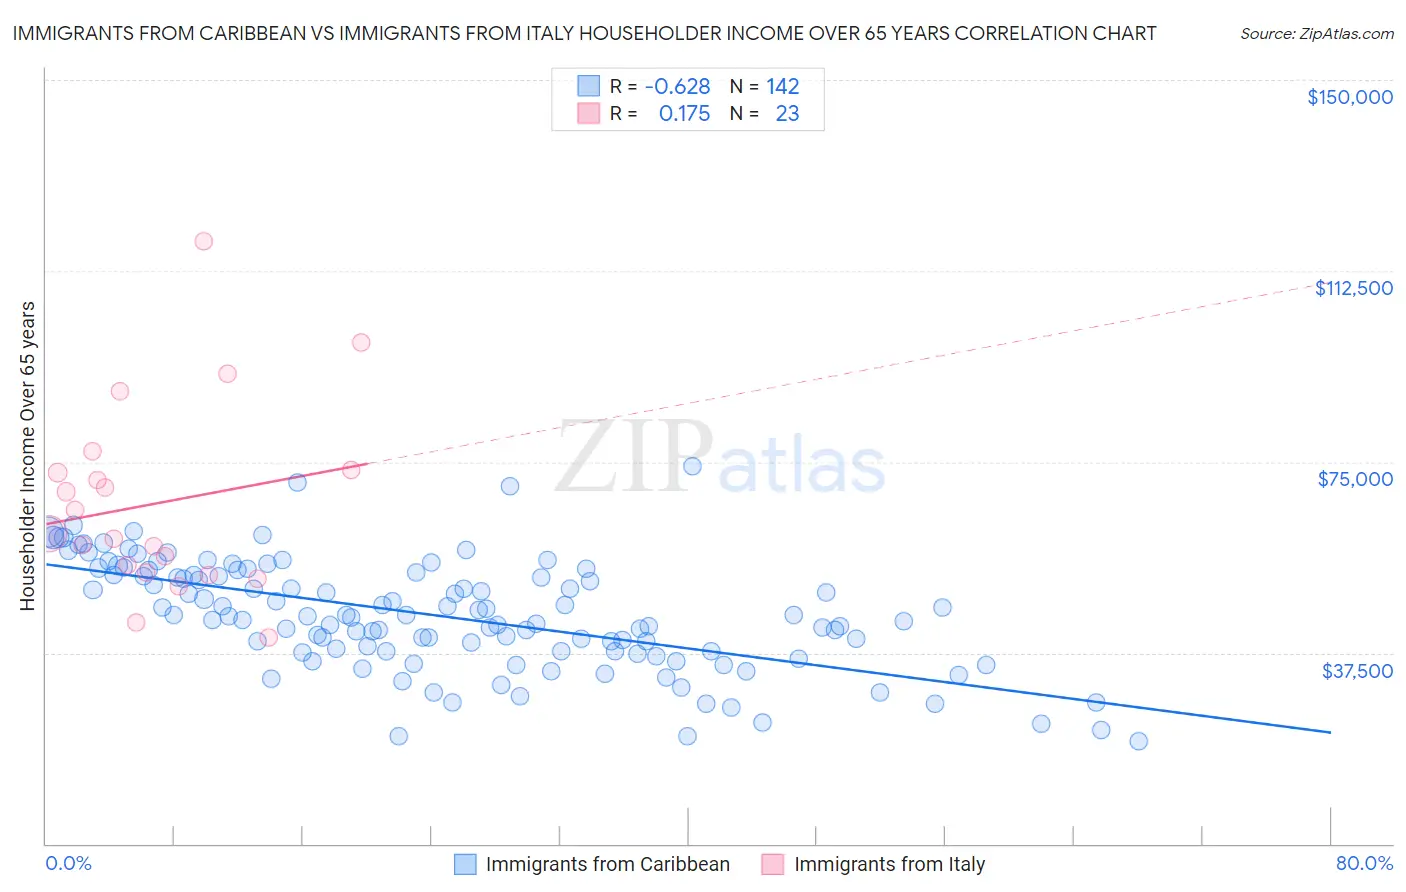
Immigrants from Caribbean vs Immigrants from Italy Householder Income Over 65 years Correlation Chart
The statistical analysis conducted on geographies consisting of 447,788,854 people shows a significant negative correlation between the proportion of Immigrants from Caribbean and household income with householder over the age of 65 in the United States with a correlation coefficient (R) of -0.628 and weighted average of $48,535. Similarly, the statistical analysis conducted on geographies consisting of 323,658,132 people shows a poor positive correlation between the proportion of Immigrants from Italy and household income with householder over the age of 65 in the United States with a correlation coefficient (R) of 0.175 and weighted average of $64,065, a difference of 32.0%.
Householder Income Over 65 years Correlation Summary
| Measurement | Immigrants from Caribbean | Immigrants from Italy |
| Minimum | $20,075 | $40,625 |
| Maximum | $74,155 | $118,263 |
| Range | $54,080 | $77,638 |
| Mean | $44,830 | $66,915 |
| Median | $44,697 | $60,782 |
| Interquartile 25% (IQ1) | $37,748 | $53,273 |
| Interquartile 75% (IQ3) | $52,750 | $73,333 |
| Interquartile Range (IQR) | $15,003 | $20,060 |
| Standard Deviation (Sample) | $10,716 | $18,554 |
| Standard Deviation (Population) | $10,678 | $18,146 |
Similar Demographics by Householder Income Over 65 years
Demographics Similar to Immigrants from Caribbean by Householder Income Over 65 years
In terms of householder income over 65 years, the demographic groups most similar to Immigrants from Caribbean are Tohono O'odham ($49,121, a difference of 1.2%), Cuban ($49,152, a difference of 1.3%), Crow ($49,234, a difference of 1.4%), Navajo ($47,722, a difference of 1.7%), and Immigrants from Yemen ($47,527, a difference of 2.1%).
| Demographics | Rating | Rank | Householder Income Over 65 years |
| Pima | 0.0 /100 | #331 | Tragic $50,539 |
| Dutch West Indians | 0.0 /100 | #332 | Tragic $50,475 |
| Cape Verdeans | 0.0 /100 | #333 | Tragic $50,077 |
| Immigrants | Dominica | 0.0 /100 | #334 | Tragic $50,071 |
| Crow | 0.0 /100 | #335 | Tragic $49,234 |
| Cubans | 0.0 /100 | #336 | Tragic $49,152 |
| Tohono O'odham | 0.0 /100 | #337 | Tragic $49,121 |
| Immigrants | Caribbean | 0.0 /100 | #338 | Tragic $48,535 |
| Navajo | 0.0 /100 | #339 | Tragic $47,722 |
| Immigrants | Yemen | 0.0 /100 | #340 | Tragic $47,527 |
| Dominicans | 0.0 /100 | #341 | Tragic $46,964 |
| Immigrants | Cabo Verde | 0.0 /100 | #342 | Tragic $46,654 |
| Immigrants | Dominican Republic | 0.0 /100 | #343 | Tragic $45,758 |
| Houma | 0.0 /100 | #344 | Tragic $44,822 |
| Immigrants | Cuba | 0.0 /100 | #345 | Tragic $44,735 |
Demographics Similar to Immigrants from Italy by Householder Income Over 65 years
In terms of householder income over 65 years, the demographic groups most similar to Immigrants from Italy are Immigrants from South Eastern Asia ($64,089, a difference of 0.040%), Assyrian/Chaldean/Syriac ($64,108, a difference of 0.070%), Romanian ($64,142, a difference of 0.12%), Chilean ($63,957, a difference of 0.17%), and British ($63,940, a difference of 0.20%).
| Demographics | Rating | Rank | Householder Income Over 65 years |
| Immigrants | Egypt | 97.0 /100 | #94 | Exceptional $64,299 |
| Immigrants | Latvia | 97.0 /100 | #95 | Exceptional $64,298 |
| Immigrants | Hungary | 97.0 /100 | #96 | Exceptional $64,277 |
| Sri Lankans | 96.7 /100 | #97 | Exceptional $64,201 |
| Romanians | 96.5 /100 | #98 | Exceptional $64,142 |
| Assyrians/Chaldeans/Syriacs | 96.4 /100 | #99 | Exceptional $64,108 |
| Immigrants | South Eastern Asia | 96.3 /100 | #100 | Exceptional $64,089 |
| Immigrants | Italy | 96.2 /100 | #101 | Exceptional $64,065 |
| Chileans | 95.8 /100 | #102 | Exceptional $63,957 |
| British | 95.7 /100 | #103 | Exceptional $63,940 |
| Immigrants | Cameroon | 95.6 /100 | #104 | Exceptional $63,907 |
| Italians | 95.5 /100 | #105 | Exceptional $63,885 |
| Immigrants | Argentina | 95.5 /100 | #106 | Exceptional $63,885 |
| Pakistanis | 95.3 /100 | #107 | Exceptional $63,844 |
| Palestinians | 95.1 /100 | #108 | Exceptional $63,800 |