Native/Alaskan vs Estonian Disability Age 65 to 74
COMPARE
Native/Alaskan
Estonian
Disability Age 65 to 74
Disability Age 65 to 74 Comparison
Natives/Alaskans
Estonians
30.4%
DISABILITY AGE 65 TO 74
0.0/ 100
METRIC RATING
332nd/ 347
METRIC RANK
21.4%
DISABILITY AGE 65 TO 74
99.7/ 100
METRIC RATING
44th/ 347
METRIC RANK
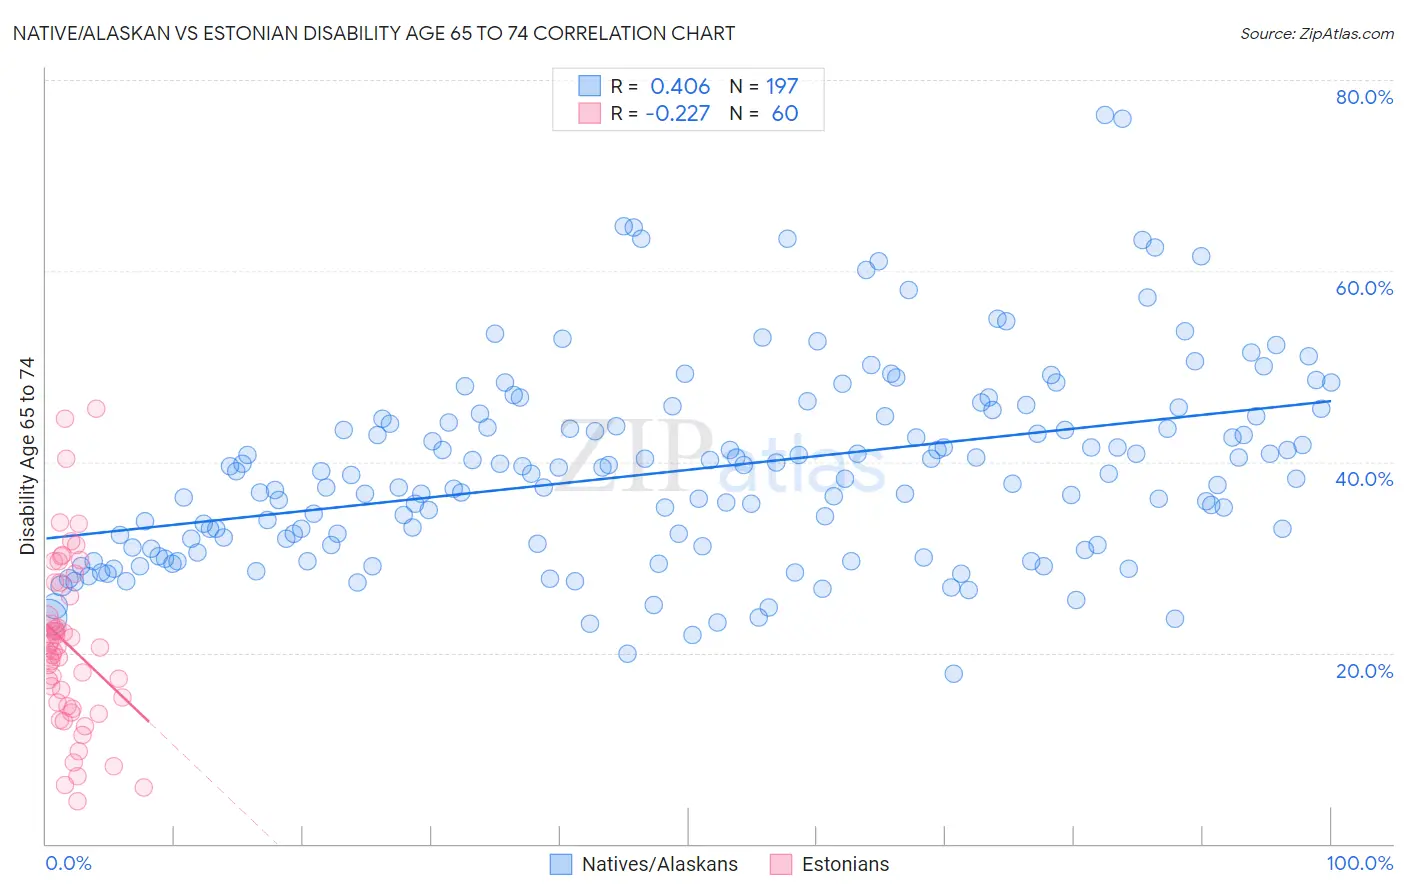
Native/Alaskan vs Estonian Disability Age 65 to 74 Correlation Chart
The statistical analysis conducted on geographies consisting of 511,555,776 people shows a moderate positive correlation between the proportion of Natives/Alaskans and percentage of population with a disability between the ages 65 and 75 in the United States with a correlation coefficient (R) of 0.406 and weighted average of 30.4%. Similarly, the statistical analysis conducted on geographies consisting of 123,436,234 people shows a weak negative correlation between the proportion of Estonians and percentage of population with a disability between the ages 65 and 75 in the United States with a correlation coefficient (R) of -0.227 and weighted average of 21.4%, a difference of 42.2%.
Disability Age 65 to 74 Correlation Summary
| Measurement | Native/Alaskan | Estonian |
| Minimum | 17.9% | 4.4% |
| Maximum | 76.4% | 45.6% |
| Range | 58.5% | 41.2% |
| Mean | 39.2% | 20.8% |
| Median | 38.6% | 20.4% |
| Interquartile 25% (IQ1) | 31.2% | 14.6% |
| Interquartile 75% (IQ3) | 44.7% | 26.6% |
| Interquartile Range (IQR) | 13.4% | 12.0% |
| Standard Deviation (Sample) | 10.3% | 8.9% |
| Standard Deviation (Population) | 10.3% | 8.8% |
Similar Demographics by Disability Age 65 to 74
Demographics Similar to Natives/Alaskans by Disability Age 65 to 74
In terms of disability age 65 to 74, the demographic groups most similar to Natives/Alaskans are Colville (30.5%, a difference of 0.52%), Chickasaw (30.2%, a difference of 0.62%), Creek (30.2%, a difference of 0.63%), Choctaw (30.2%, a difference of 0.66%), and Alaska Native (30.6%, a difference of 0.77%).
| Demographics | Rating | Rank | Disability Age 65 to 74 |
| Dutch West Indians | 0.0 /100 | #325 | Tragic 29.6% |
| Yakama | 0.0 /100 | #326 | Tragic 29.6% |
| Apache | 0.0 /100 | #327 | Tragic 29.7% |
| Hopi | 0.0 /100 | #328 | Tragic 30.0% |
| Choctaw | 0.0 /100 | #329 | Tragic 30.2% |
| Creek | 0.0 /100 | #330 | Tragic 30.2% |
| Chickasaw | 0.0 /100 | #331 | Tragic 30.2% |
| Natives/Alaskans | 0.0 /100 | #332 | Tragic 30.4% |
| Colville | 0.0 /100 | #333 | Tragic 30.5% |
| Alaska Natives | 0.0 /100 | #334 | Tragic 30.6% |
| Cheyenne | 0.0 /100 | #335 | Tragic 31.1% |
| Yuman | 0.0 /100 | #336 | Tragic 31.5% |
| Houma | 0.0 /100 | #337 | Tragic 32.3% |
| Alaskan Athabascans | 0.0 /100 | #338 | Tragic 32.4% |
| Kiowa | 0.0 /100 | #339 | Tragic 32.6% |
Demographics Similar to Estonians by Disability Age 65 to 74
In terms of disability age 65 to 74, the demographic groups most similar to Estonians are Asian (21.4%, a difference of 0.020%), Immigrants from Turkey (21.4%, a difference of 0.050%), Immigrants from Bulgaria (21.4%, a difference of 0.050%), Lithuanian (21.4%, a difference of 0.10%), and Luxembourger (21.4%, a difference of 0.10%).
| Demographics | Rating | Rank | Disability Age 65 to 74 |
| Israelis | 99.8 /100 | #37 | Exceptional 21.2% |
| Russians | 99.8 /100 | #38 | Exceptional 21.2% |
| Argentineans | 99.8 /100 | #39 | Exceptional 21.2% |
| Latvians | 99.8 /100 | #40 | Exceptional 21.2% |
| Immigrants | Austria | 99.8 /100 | #41 | Exceptional 21.2% |
| Macedonians | 99.7 /100 | #42 | Exceptional 21.3% |
| Immigrants | Croatia | 99.7 /100 | #43 | Exceptional 21.3% |
| Estonians | 99.7 /100 | #44 | Exceptional 21.4% |
| Asians | 99.7 /100 | #45 | Exceptional 21.4% |
| Immigrants | Turkey | 99.7 /100 | #46 | Exceptional 21.4% |
| Immigrants | Bulgaria | 99.7 /100 | #47 | Exceptional 21.4% |
| Lithuanians | 99.7 /100 | #48 | Exceptional 21.4% |
| Luxembourgers | 99.7 /100 | #49 | Exceptional 21.4% |
| Immigrants | Malaysia | 99.7 /100 | #50 | Exceptional 21.4% |
| Immigrants | Serbia | 99.6 /100 | #51 | Exceptional 21.4% |