Samoan vs Estonian Householder Income Over 65 years
COMPARE
Samoan
Estonian
Householder Income Over 65 years
Householder Income Over 65 years Comparison
Samoans
Estonians
$65,427
HOUSEHOLDER INCOME OVER 65 YEARS
99.1/ 100
METRIC RATING
69th/ 347
METRIC RANK
$67,926
HOUSEHOLDER INCOME OVER 65 YEARS
99.9/ 100
METRIC RATING
38th/ 347
METRIC RANK
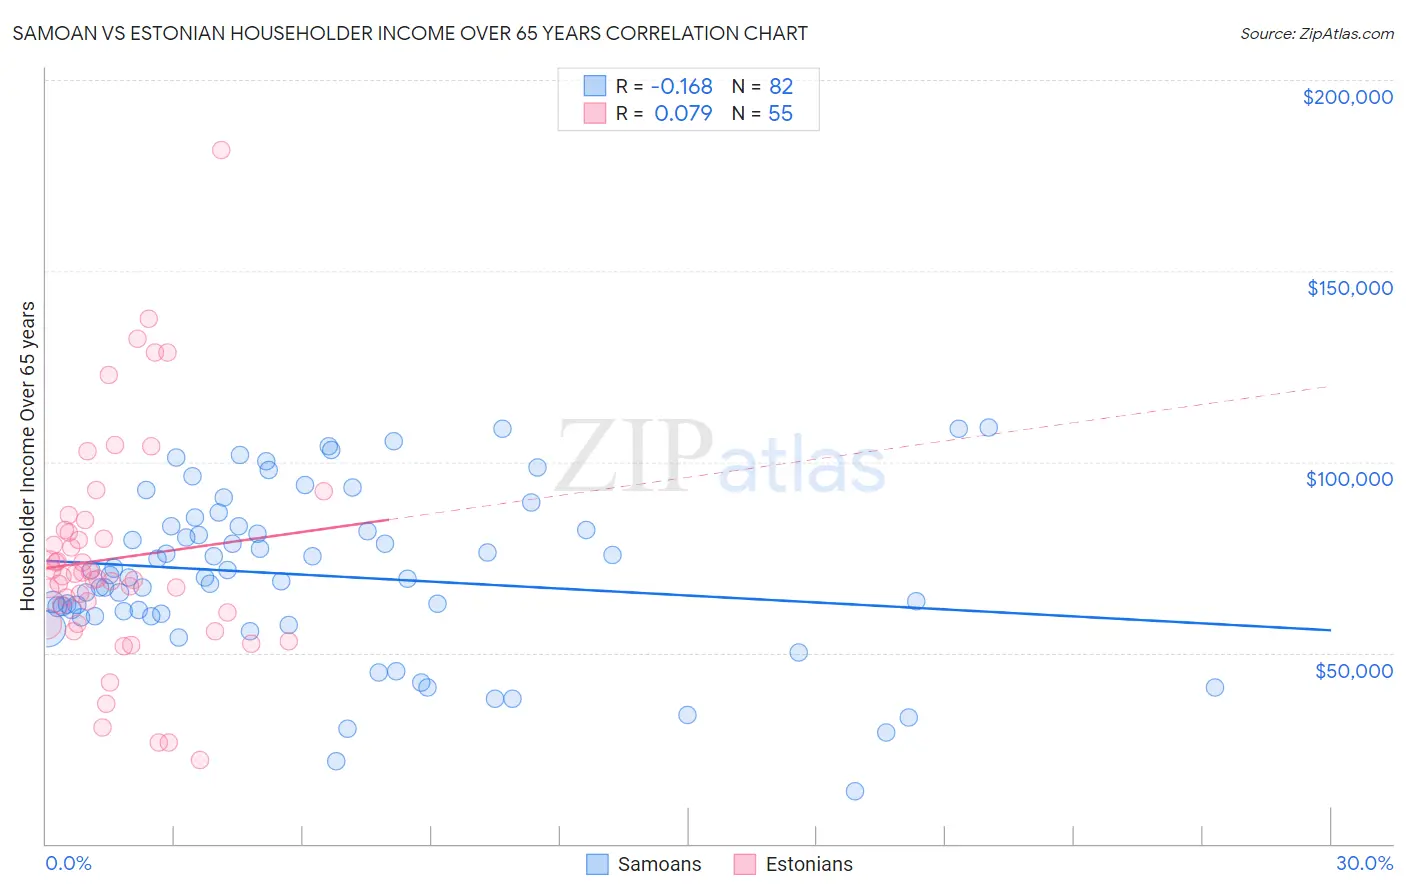
Samoan vs Estonian Householder Income Over 65 years Correlation Chart
The statistical analysis conducted on geographies consisting of 224,404,839 people shows a poor negative correlation between the proportion of Samoans and household income with householder over the age of 65 in the United States with a correlation coefficient (R) of -0.168 and weighted average of $65,427. Similarly, the statistical analysis conducted on geographies consisting of 123,423,480 people shows a slight positive correlation between the proportion of Estonians and household income with householder over the age of 65 in the United States with a correlation coefficient (R) of 0.079 and weighted average of $67,926, a difference of 3.8%.
Householder Income Over 65 years Correlation Summary
| Measurement | Samoan | Estonian |
| Minimum | $13,651 | $21,786 |
| Maximum | $108,977 | $181,719 |
| Range | $95,326 | $159,933 |
| Mean | $70,206 | $74,728 |
| Median | $69,618 | $70,115 |
| Interquartile 25% (IQ1) | $59,611 | $57,743 |
| Interquartile 75% (IQ3) | $83,086 | $82,145 |
| Interquartile Range (IQR) | $23,475 | $24,401 |
| Standard Deviation (Sample) | $21,405 | $29,421 |
| Standard Deviation (Population) | $21,274 | $29,152 |
Similar Demographics by Householder Income Over 65 years
Demographics Similar to Samoans by Householder Income Over 65 years
In terms of householder income over 65 years, the demographic groups most similar to Samoans are Egyptian ($65,441, a difference of 0.020%), Immigrants from Malaysia ($65,497, a difference of 0.11%), Mongolian ($65,326, a difference of 0.15%), Greek ($65,306, a difference of 0.19%), and Argentinean ($65,246, a difference of 0.28%).
| Demographics | Rating | Rank | Householder Income Over 65 years |
| Immigrants | Sierra Leone | 99.5 /100 | #62 | Exceptional $66,009 |
| Marshallese | 99.4 /100 | #63 | Exceptional $65,874 |
| Zimbabweans | 99.4 /100 | #64 | Exceptional $65,854 |
| Immigrants | England | 99.3 /100 | #65 | Exceptional $65,715 |
| South Africans | 99.3 /100 | #66 | Exceptional $65,652 |
| Immigrants | Malaysia | 99.1 /100 | #67 | Exceptional $65,497 |
| Egyptians | 99.1 /100 | #68 | Exceptional $65,441 |
| Samoans | 99.1 /100 | #69 | Exceptional $65,427 |
| Mongolians | 99.0 /100 | #70 | Exceptional $65,326 |
| Greeks | 98.9 /100 | #71 | Exceptional $65,306 |
| Argentineans | 98.9 /100 | #72 | Exceptional $65,246 |
| Immigrants | Ethiopia | 98.9 /100 | #73 | Exceptional $65,238 |
| Lithuanians | 98.8 /100 | #74 | Exceptional $65,209 |
| Sierra Leoneans | 98.6 /100 | #75 | Exceptional $65,038 |
| Ethiopians | 98.5 /100 | #76 | Exceptional $64,989 |
Demographics Similar to Estonians by Householder Income Over 65 years
In terms of householder income over 65 years, the demographic groups most similar to Estonians are Turkish ($68,037, a difference of 0.16%), Immigrants from Austria ($68,208, a difference of 0.42%), Russian ($67,626, a difference of 0.44%), Tongan ($68,235, a difference of 0.46%), and Immigrants from Asia ($67,594, a difference of 0.49%).
| Demographics | Rating | Rank | Householder Income Over 65 years |
| Afghans | 100.0 /100 | #31 | Exceptional $68,951 |
| Asians | 100.0 /100 | #32 | Exceptional $68,822 |
| Immigrants | Denmark | 100.0 /100 | #33 | Exceptional $68,801 |
| Immigrants | Ireland | 100.0 /100 | #34 | Exceptional $68,495 |
| Tongans | 100.0 /100 | #35 | Exceptional $68,235 |
| Immigrants | Austria | 99.9 /100 | #36 | Exceptional $68,208 |
| Turks | 99.9 /100 | #37 | Exceptional $68,037 |
| Estonians | 99.9 /100 | #38 | Exceptional $67,926 |
| Russians | 99.9 /100 | #39 | Exceptional $67,626 |
| Immigrants | Asia | 99.9 /100 | #40 | Exceptional $67,594 |
| Koreans | 99.9 /100 | #41 | Exceptional $67,472 |
| New Zealanders | 99.9 /100 | #42 | Exceptional $67,333 |
| Latvians | 99.9 /100 | #43 | Exceptional $67,326 |
| Immigrants | South Africa | 99.9 /100 | #44 | Exceptional $67,234 |
| Immigrants | Afghanistan | 99.8 /100 | #45 | Exceptional $67,007 |