Menominee vs Immigrants from Sudan Per Capita Income
COMPARE
Menominee
Immigrants from Sudan
Per Capita Income
Per Capita Income Comparison
Menominee
Immigrants from Sudan
$34,578
PER CAPITA INCOME
0.0/ 100
METRIC RATING
328th/ 347
METRIC RANK
$41,986
PER CAPITA INCOME
13.2/ 100
METRIC RATING
209th/ 347
METRIC RANK
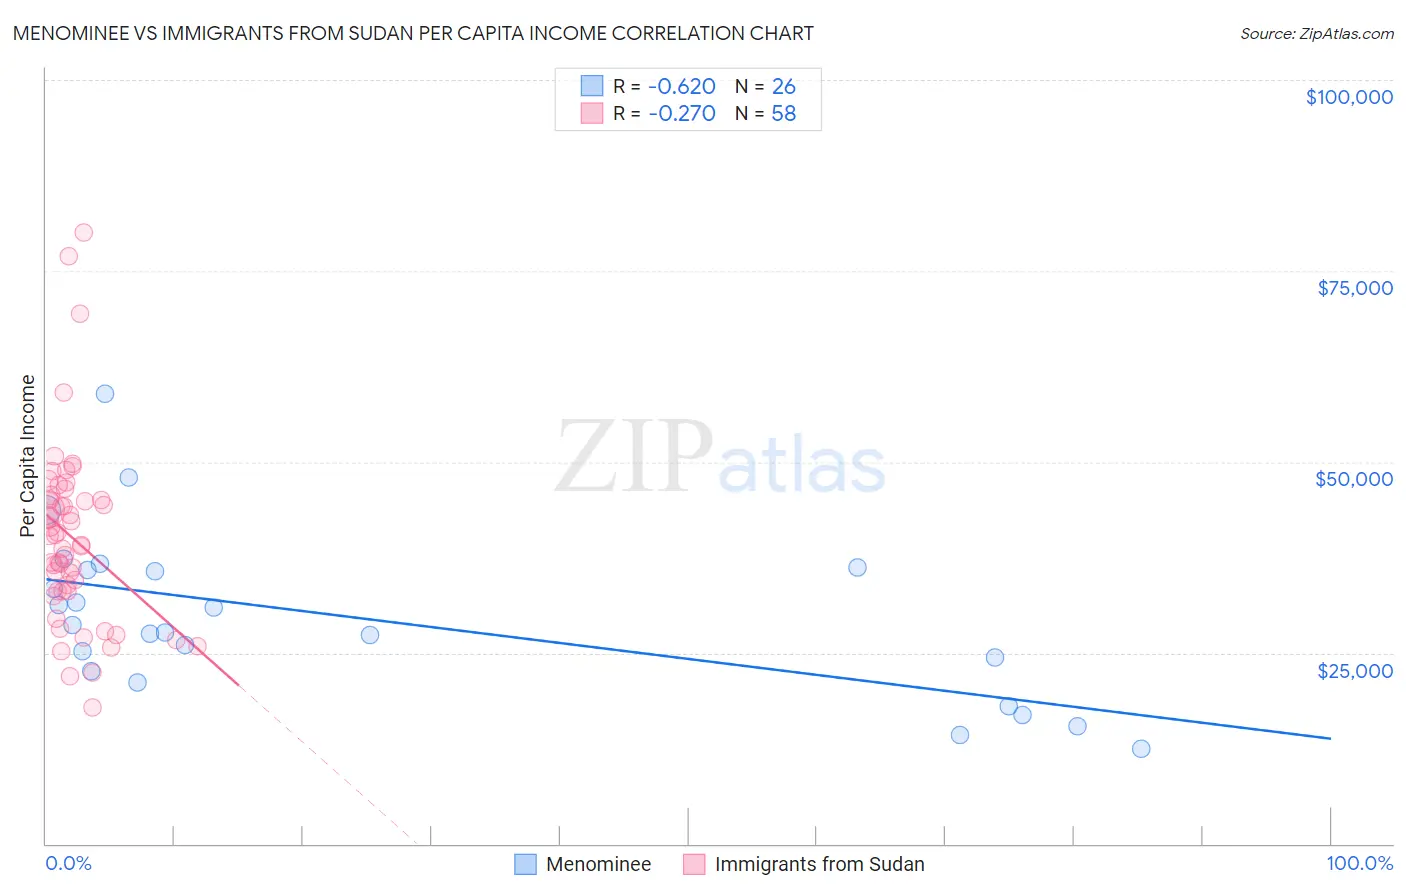
Menominee vs Immigrants from Sudan Per Capita Income Correlation Chart
The statistical analysis conducted on geographies consisting of 45,778,979 people shows a significant negative correlation between the proportion of Menominee and per capita income in the United States with a correlation coefficient (R) of -0.620 and weighted average of $34,578. Similarly, the statistical analysis conducted on geographies consisting of 118,972,993 people shows a weak negative correlation between the proportion of Immigrants from Sudan and per capita income in the United States with a correlation coefficient (R) of -0.270 and weighted average of $41,986, a difference of 21.4%.
Per Capita Income Correlation Summary
| Measurement | Menominee | Immigrants from Sudan |
| Minimum | $12,454 | $17,842 |
| Maximum | $58,872 | $80,005 |
| Range | $46,418 | $62,163 |
| Mean | $29,500 | $40,107 |
| Median | $28,225 | $39,743 |
| Interquartile 25% (IQ1) | $22,568 | $33,055 |
| Interquartile 75% (IQ3) | $35,908 | $45,054 |
| Interquartile Range (IQR) | $13,340 | $11,999 |
| Standard Deviation (Sample) | $10,696 | $11,901 |
| Standard Deviation (Population) | $10,488 | $11,798 |
Similar Demographics by Per Capita Income
Demographics Similar to Menominee by Per Capita Income
In terms of per capita income, the demographic groups most similar to Menominee are Mexican ($34,559, a difference of 0.060%), Apache ($34,886, a difference of 0.89%), Immigrants from Cuba ($34,910, a difference of 0.96%), Spanish American Indian ($34,195, a difference of 1.1%), and Immigrants from Central America ($34,974, a difference of 1.1%).
| Demographics | Rating | Rank | Per Capita Income |
| Blacks/African Americans | 0.0 /100 | #321 | Tragic $35,564 |
| Creek | 0.0 /100 | #322 | Tragic $35,546 |
| Cheyenne | 0.0 /100 | #323 | Tragic $35,276 |
| Kiowa | 0.0 /100 | #324 | Tragic $35,102 |
| Immigrants | Central America | 0.0 /100 | #325 | Tragic $34,974 |
| Immigrants | Cuba | 0.0 /100 | #326 | Tragic $34,910 |
| Apache | 0.0 /100 | #327 | Tragic $34,886 |
| Menominee | 0.0 /100 | #328 | Tragic $34,578 |
| Mexicans | 0.0 /100 | #329 | Tragic $34,559 |
| Spanish American Indians | 0.0 /100 | #330 | Tragic $34,195 |
| Immigrants | Mexico | 0.0 /100 | #331 | Tragic $33,931 |
| Sioux | 0.0 /100 | #332 | Tragic $33,921 |
| Immigrants | Yemen | 0.0 /100 | #333 | Tragic $33,696 |
| Natives/Alaskans | 0.0 /100 | #334 | Tragic $33,279 |
| Yuman | 0.0 /100 | #335 | Tragic $33,236 |
Demographics Similar to Immigrants from Sudan by Per Capita Income
In terms of per capita income, the demographic groups most similar to Immigrants from Sudan are Ecuadorian ($41,958, a difference of 0.070%), Panamanian ($42,035, a difference of 0.12%), Venezuelan ($42,074, a difference of 0.21%), Immigrants from Panama ($41,853, a difference of 0.32%), and Immigrants from Senegal ($41,830, a difference of 0.37%).
| Demographics | Rating | Rank | Per Capita Income |
| Immigrants | Bosnia and Herzegovina | 17.5 /100 | #202 | Poor $42,278 |
| Spanish | 17.0 /100 | #203 | Poor $42,249 |
| Aleuts | 16.4 /100 | #204 | Poor $42,210 |
| Whites/Caucasians | 15.9 /100 | #205 | Poor $42,180 |
| Ghanaians | 15.7 /100 | #206 | Poor $42,164 |
| Venezuelans | 14.4 /100 | #207 | Poor $42,074 |
| Panamanians | 13.9 /100 | #208 | Poor $42,035 |
| Immigrants | Sudan | 13.2 /100 | #209 | Poor $41,986 |
| Ecuadorians | 12.9 /100 | #210 | Poor $41,958 |
| Immigrants | Panama | 11.6 /100 | #211 | Poor $41,853 |
| Immigrants | Senegal | 11.3 /100 | #212 | Poor $41,830 |
| Immigrants | Venezuela | 10.2 /100 | #213 | Poor $41,727 |
| Immigrants | Bangladesh | 10.1 /100 | #214 | Poor $41,709 |
| Sudanese | 9.9 /100 | #215 | Tragic $41,695 |
| Tongans | 9.9 /100 | #216 | Tragic $41,693 |