Moroccan vs Immigrants from Africa Per Capita Income
COMPARE
Moroccan
Immigrants from Africa
Per Capita Income
Per Capita Income Comparison
Moroccans
Immigrants from Africa
$45,854
PER CAPITA INCOME
92.1/ 100
METRIC RATING
122nd/ 347
METRIC RANK
$42,950
PER CAPITA INCOME
31.0/ 100
METRIC RATING
188th/ 347
METRIC RANK
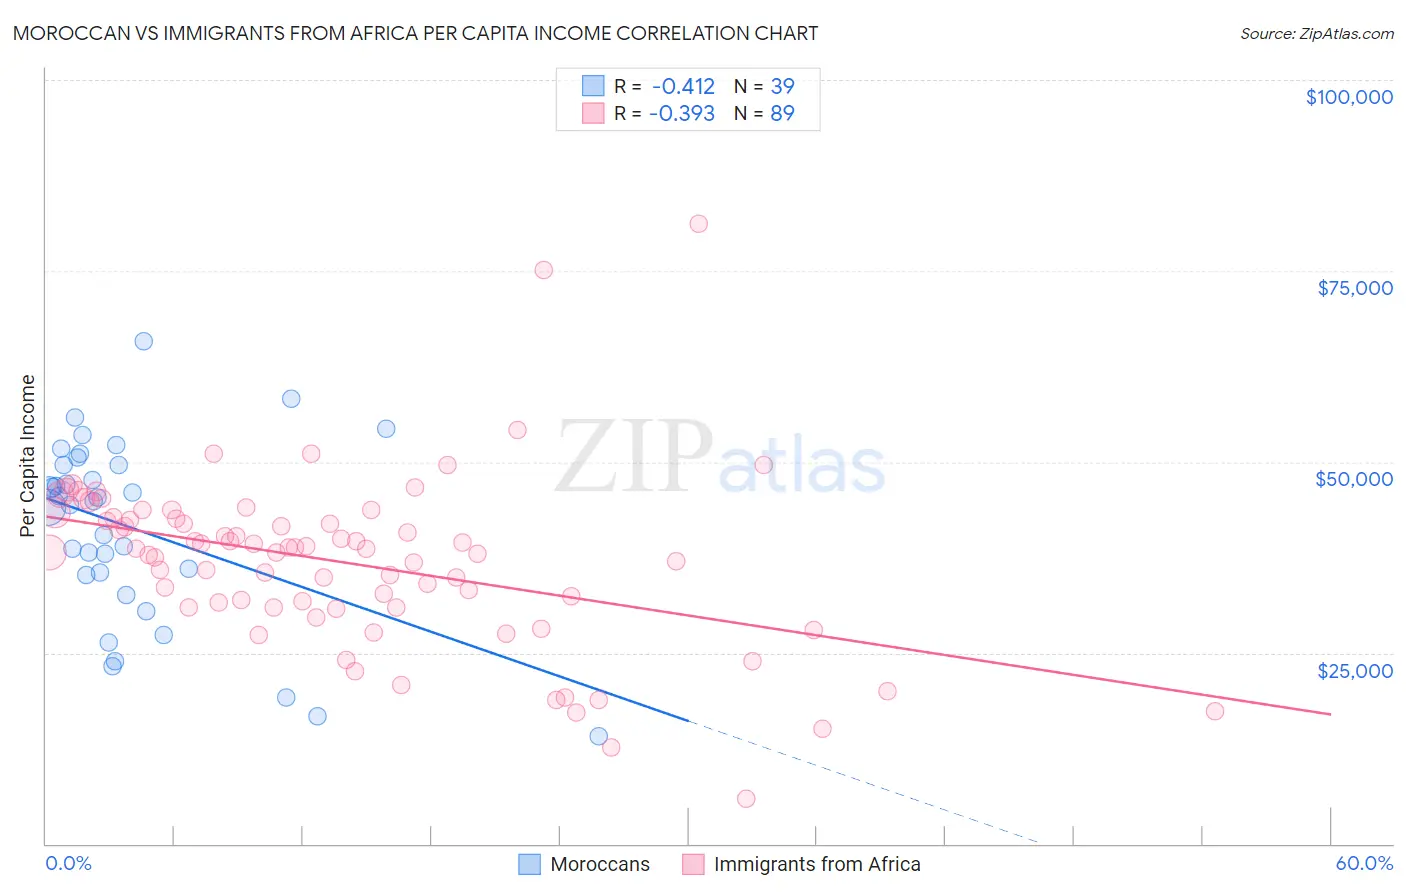
Moroccan vs Immigrants from Africa Per Capita Income Correlation Chart
The statistical analysis conducted on geographies consisting of 201,819,214 people shows a moderate negative correlation between the proportion of Moroccans and per capita income in the United States with a correlation coefficient (R) of -0.412 and weighted average of $45,854. Similarly, the statistical analysis conducted on geographies consisting of 469,482,271 people shows a mild negative correlation between the proportion of Immigrants from Africa and per capita income in the United States with a correlation coefficient (R) of -0.393 and weighted average of $42,950, a difference of 6.8%.
Per Capita Income Correlation Summary
| Measurement | Moroccan | Immigrants from Africa |
| Minimum | $14,047 | $5,866 |
| Maximum | $65,725 | $81,151 |
| Range | $51,678 | $75,285 |
| Mean | $41,336 | $36,831 |
| Median | $44,873 | $38,619 |
| Interquartile 25% (IQ1) | $35,130 | $30,955 |
| Interquartile 75% (IQ3) | $49,634 | $42,606 |
| Interquartile Range (IQR) | $14,504 | $11,650 |
| Standard Deviation (Sample) | $11,952 | $11,377 |
| Standard Deviation (Population) | $11,797 | $11,312 |
Similar Demographics by Per Capita Income
Demographics Similar to Moroccans by Per Capita Income
In terms of per capita income, the demographic groups most similar to Moroccans are Canadian ($45,858, a difference of 0.010%), Lebanese ($45,840, a difference of 0.030%), European ($45,836, a difference of 0.040%), Zimbabwean ($45,804, a difference of 0.11%), and Palestinian ($45,790, a difference of 0.14%).
| Demographics | Rating | Rank | Per Capita Income |
| Immigrants | Chile | 94.6 /100 | #115 | Exceptional $46,213 |
| Poles | 94.1 /100 | #116 | Exceptional $46,123 |
| Chinese | 93.9 /100 | #117 | Exceptional $46,098 |
| Immigrants | Saudi Arabia | 93.3 /100 | #118 | Exceptional $46,008 |
| Immigrants | Poland | 93.1 /100 | #119 | Exceptional $45,979 |
| Immigrants | Ethiopia | 92.7 /100 | #120 | Exceptional $45,923 |
| Canadians | 92.2 /100 | #121 | Exceptional $45,858 |
| Moroccans | 92.1 /100 | #122 | Exceptional $45,854 |
| Lebanese | 92.0 /100 | #123 | Exceptional $45,840 |
| Europeans | 92.0 /100 | #124 | Exceptional $45,836 |
| Zimbabweans | 91.7 /100 | #125 | Exceptional $45,804 |
| Palestinians | 91.6 /100 | #126 | Exceptional $45,790 |
| Immigrants | Germany | 91.3 /100 | #127 | Exceptional $45,751 |
| Swedes | 91.3 /100 | #128 | Exceptional $45,750 |
| Luxembourgers | 90.4 /100 | #129 | Exceptional $45,663 |
Demographics Similar to Immigrants from Africa by Per Capita Income
In terms of per capita income, the demographic groups most similar to Immigrants from Africa are Immigrants from Colombia ($42,971, a difference of 0.050%), Bermudan ($42,911, a difference of 0.090%), French Canadian ($43,003, a difference of 0.12%), Immigrants ($43,010, a difference of 0.14%), and Spaniard ($43,028, a difference of 0.18%).
| Demographics | Rating | Rank | Per Capita Income |
| Welsh | 38.2 /100 | #181 | Fair $43,233 |
| Immigrants | Vietnam | 38.1 /100 | #182 | Fair $43,229 |
| Germans | 33.9 /100 | #183 | Fair $43,067 |
| Spaniards | 32.9 /100 | #184 | Fair $43,028 |
| Immigrants | Immigrants | 32.5 /100 | #185 | Fair $43,010 |
| French Canadians | 32.3 /100 | #186 | Fair $43,003 |
| Immigrants | Colombia | 31.5 /100 | #187 | Fair $42,971 |
| Immigrants | Africa | 31.0 /100 | #188 | Fair $42,950 |
| Bermudans | 30.1 /100 | #189 | Fair $42,911 |
| Kenyans | 27.7 /100 | #190 | Fair $42,808 |
| Yugoslavians | 27.4 /100 | #191 | Fair $42,792 |
| Iraqis | 26.7 /100 | #192 | Fair $42,760 |
| Immigrants | Sierra Leone | 26.5 /100 | #193 | Fair $42,752 |
| Immigrants | Fiji | 25.2 /100 | #194 | Fair $42,694 |
| Immigrants | Kenya | 24.5 /100 | #195 | Fair $42,661 |