Moroccan vs French American Indian Per Capita Income
COMPARE
Moroccan
French American Indian
Per Capita Income
Per Capita Income Comparison
Moroccans
French American Indians
$45,854
PER CAPITA INCOME
92.1/ 100
METRIC RATING
122nd/ 347
METRIC RANK
$40,244
PER CAPITA INCOME
2.1/ 100
METRIC RATING
244th/ 347
METRIC RANK
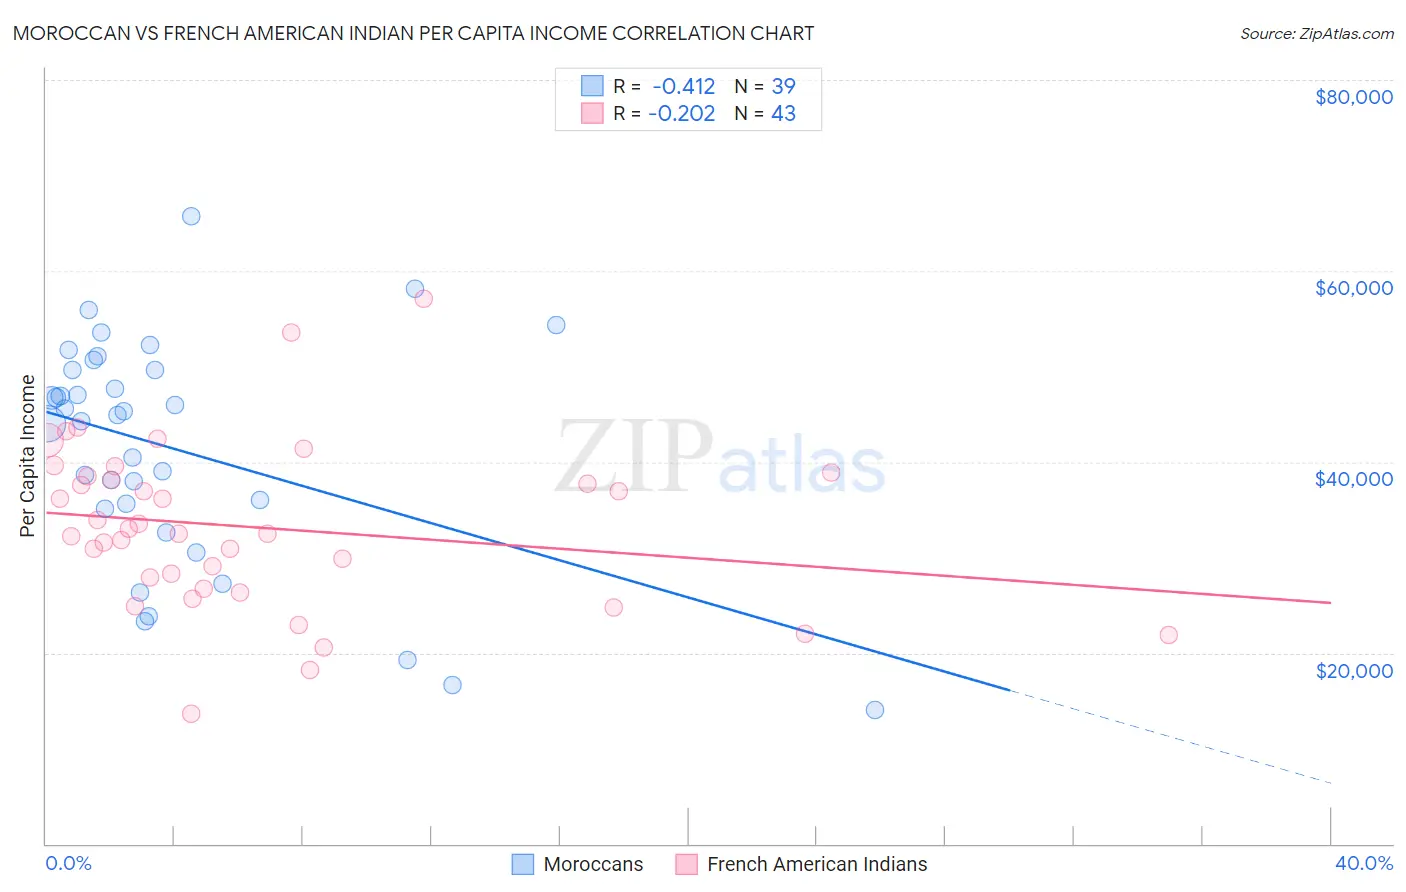
Moroccan vs French American Indian Per Capita Income Correlation Chart
The statistical analysis conducted on geographies consisting of 201,819,214 people shows a moderate negative correlation between the proportion of Moroccans and per capita income in the United States with a correlation coefficient (R) of -0.412 and weighted average of $45,854. Similarly, the statistical analysis conducted on geographies consisting of 131,975,147 people shows a weak negative correlation between the proportion of French American Indians and per capita income in the United States with a correlation coefficient (R) of -0.202 and weighted average of $40,244, a difference of 13.9%.
Per Capita Income Correlation Summary
| Measurement | Moroccan | French American Indian |
| Minimum | $14,047 | $13,560 |
| Maximum | $65,725 | $57,062 |
| Range | $51,678 | $43,502 |
| Mean | $41,336 | $33,133 |
| Median | $44,873 | $32,489 |
| Interquartile 25% (IQ1) | $35,130 | $26,698 |
| Interquartile 75% (IQ3) | $49,634 | $38,474 |
| Interquartile Range (IQR) | $14,504 | $11,776 |
| Standard Deviation (Sample) | $11,952 | $8,715 |
| Standard Deviation (Population) | $11,797 | $8,613 |
Similar Demographics by Per Capita Income
Demographics Similar to Moroccans by Per Capita Income
In terms of per capita income, the demographic groups most similar to Moroccans are Canadian ($45,858, a difference of 0.010%), Lebanese ($45,840, a difference of 0.030%), European ($45,836, a difference of 0.040%), Zimbabwean ($45,804, a difference of 0.11%), and Palestinian ($45,790, a difference of 0.14%).
| Demographics | Rating | Rank | Per Capita Income |
| Immigrants | Chile | 94.6 /100 | #115 | Exceptional $46,213 |
| Poles | 94.1 /100 | #116 | Exceptional $46,123 |
| Chinese | 93.9 /100 | #117 | Exceptional $46,098 |
| Immigrants | Saudi Arabia | 93.3 /100 | #118 | Exceptional $46,008 |
| Immigrants | Poland | 93.1 /100 | #119 | Exceptional $45,979 |
| Immigrants | Ethiopia | 92.7 /100 | #120 | Exceptional $45,923 |
| Canadians | 92.2 /100 | #121 | Exceptional $45,858 |
| Moroccans | 92.1 /100 | #122 | Exceptional $45,854 |
| Lebanese | 92.0 /100 | #123 | Exceptional $45,840 |
| Europeans | 92.0 /100 | #124 | Exceptional $45,836 |
| Zimbabweans | 91.7 /100 | #125 | Exceptional $45,804 |
| Palestinians | 91.6 /100 | #126 | Exceptional $45,790 |
| Immigrants | Germany | 91.3 /100 | #127 | Exceptional $45,751 |
| Swedes | 91.3 /100 | #128 | Exceptional $45,750 |
| Luxembourgers | 90.4 /100 | #129 | Exceptional $45,663 |
Demographics Similar to French American Indians by Per Capita Income
In terms of per capita income, the demographic groups most similar to French American Indians are German Russian ($40,266, a difference of 0.060%), Immigrants from Western Africa ($40,294, a difference of 0.13%), British West Indian ($40,330, a difference of 0.21%), Subsaharan African ($40,152, a difference of 0.23%), and Immigrants from Nigeria ($40,339, a difference of 0.24%).
| Demographics | Rating | Rank | Per Capita Income |
| Immigrants | Cambodia | 2.6 /100 | #237 | Tragic $40,434 |
| Somalis | 2.4 /100 | #238 | Tragic $40,367 |
| Tsimshian | 2.4 /100 | #239 | Tragic $40,344 |
| Immigrants | Nigeria | 2.3 /100 | #240 | Tragic $40,339 |
| British West Indians | 2.3 /100 | #241 | Tragic $40,330 |
| Immigrants | Western Africa | 2.2 /100 | #242 | Tragic $40,294 |
| German Russians | 2.2 /100 | #243 | Tragic $40,266 |
| French American Indians | 2.1 /100 | #244 | Tragic $40,244 |
| Sub-Saharan Africans | 1.9 /100 | #245 | Tragic $40,152 |
| Cree | 1.7 /100 | #246 | Tragic $40,056 |
| Immigrants | Somalia | 1.6 /100 | #247 | Tragic $39,974 |
| Cape Verdeans | 1.5 /100 | #248 | Tragic $39,935 |
| Japanese | 1.4 /100 | #249 | Tragic $39,870 |
| Immigrants | Burma/Myanmar | 1.3 /100 | #250 | Tragic $39,827 |
| Samoans | 1.3 /100 | #251 | Tragic $39,826 |