Moroccan vs Immigrants from India Per Capita Income
COMPARE
Moroccan
Immigrants from India
Per Capita Income
Per Capita Income Comparison
Moroccans
Immigrants from India
$45,854
PER CAPITA INCOME
92.1/ 100
METRIC RATING
122nd/ 347
METRIC RANK
$55,268
PER CAPITA INCOME
100.0/ 100
METRIC RATING
13th/ 347
METRIC RANK
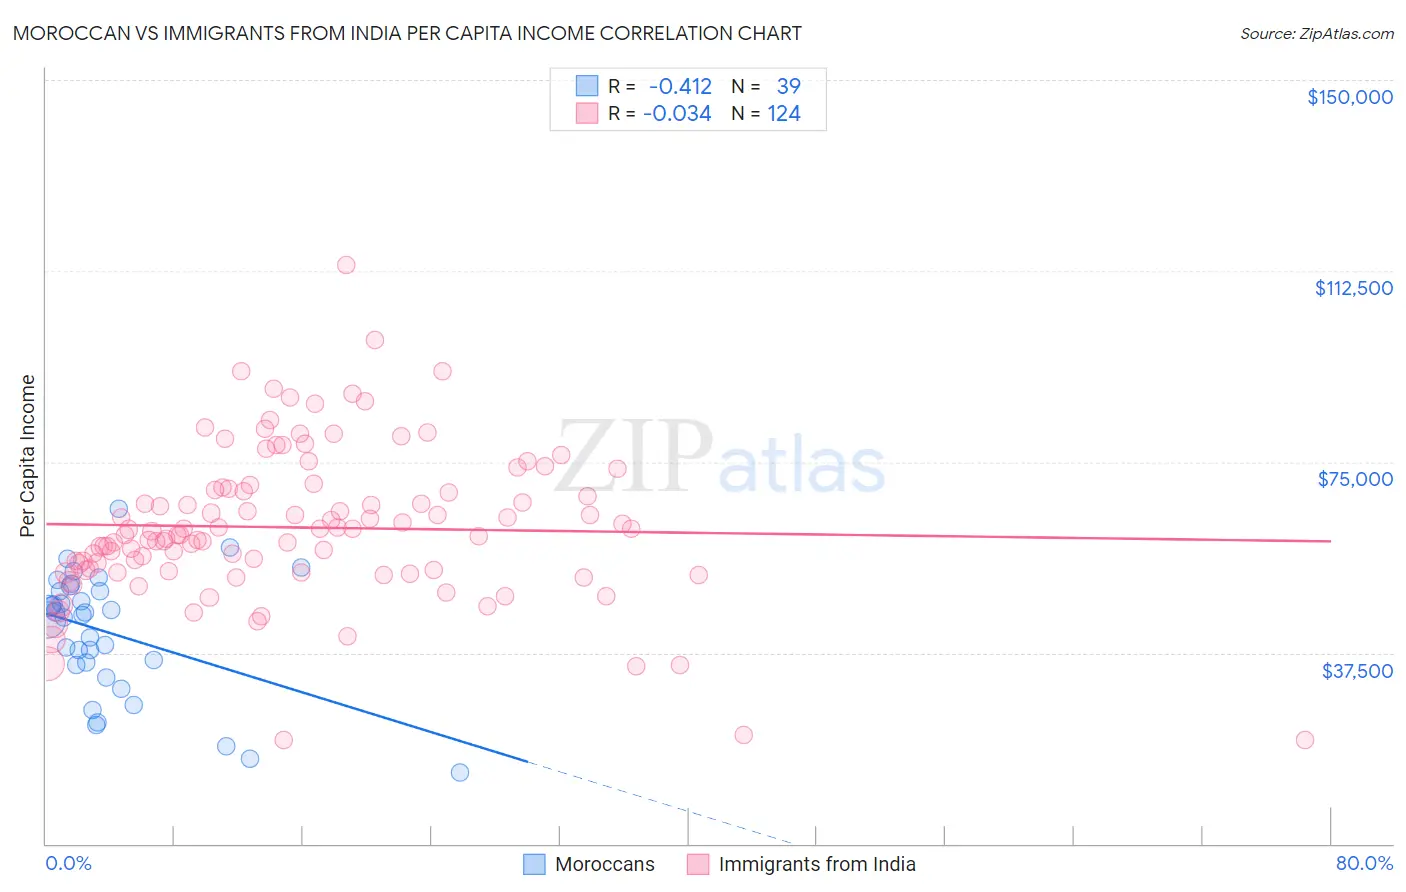
Moroccan vs Immigrants from India Per Capita Income Correlation Chart
The statistical analysis conducted on geographies consisting of 201,819,214 people shows a moderate negative correlation between the proportion of Moroccans and per capita income in the United States with a correlation coefficient (R) of -0.412 and weighted average of $45,854. Similarly, the statistical analysis conducted on geographies consisting of 434,146,004 people shows no correlation between the proportion of Immigrants from India and per capita income in the United States with a correlation coefficient (R) of -0.034 and weighted average of $55,268, a difference of 20.5%.
Per Capita Income Correlation Summary
| Measurement | Moroccan | Immigrants from India |
| Minimum | $14,047 | $20,341 |
| Maximum | $65,725 | $113,550 |
| Range | $51,678 | $93,209 |
| Mean | $41,336 | $62,129 |
| Median | $44,873 | $60,635 |
| Interquartile 25% (IQ1) | $35,130 | $53,591 |
| Interquartile 75% (IQ3) | $49,634 | $69,609 |
| Interquartile Range (IQR) | $14,504 | $16,018 |
| Standard Deviation (Sample) | $11,952 | $14,973 |
| Standard Deviation (Population) | $11,797 | $14,913 |
Similar Demographics by Per Capita Income
Demographics Similar to Moroccans by Per Capita Income
In terms of per capita income, the demographic groups most similar to Moroccans are Canadian ($45,858, a difference of 0.010%), Lebanese ($45,840, a difference of 0.030%), European ($45,836, a difference of 0.040%), Zimbabwean ($45,804, a difference of 0.11%), and Palestinian ($45,790, a difference of 0.14%).
| Demographics | Rating | Rank | Per Capita Income |
| Immigrants | Chile | 94.6 /100 | #115 | Exceptional $46,213 |
| Poles | 94.1 /100 | #116 | Exceptional $46,123 |
| Chinese | 93.9 /100 | #117 | Exceptional $46,098 |
| Immigrants | Saudi Arabia | 93.3 /100 | #118 | Exceptional $46,008 |
| Immigrants | Poland | 93.1 /100 | #119 | Exceptional $45,979 |
| Immigrants | Ethiopia | 92.7 /100 | #120 | Exceptional $45,923 |
| Canadians | 92.2 /100 | #121 | Exceptional $45,858 |
| Moroccans | 92.1 /100 | #122 | Exceptional $45,854 |
| Lebanese | 92.0 /100 | #123 | Exceptional $45,840 |
| Europeans | 92.0 /100 | #124 | Exceptional $45,836 |
| Zimbabweans | 91.7 /100 | #125 | Exceptional $45,804 |
| Palestinians | 91.6 /100 | #126 | Exceptional $45,790 |
| Immigrants | Germany | 91.3 /100 | #127 | Exceptional $45,751 |
| Swedes | 91.3 /100 | #128 | Exceptional $45,750 |
| Luxembourgers | 90.4 /100 | #129 | Exceptional $45,663 |
Demographics Similar to Immigrants from India by Per Capita Income
In terms of per capita income, the demographic groups most similar to Immigrants from India are Immigrants from Belgium ($55,082, a difference of 0.34%), Immigrants from Sweden ($55,582, a difference of 0.57%), Cypriot ($54,899, a difference of 0.67%), Immigrants from Switzerland ($54,866, a difference of 0.73%), and Eastern European ($55,780, a difference of 0.93%).
| Demographics | Rating | Rank | Per Capita Income |
| Immigrants | Taiwan | 100.0 /100 | #6 | Exceptional $57,742 |
| Immigrants | Israel | 100.0 /100 | #7 | Exceptional $57,384 |
| Immigrants | Hong Kong | 100.0 /100 | #8 | Exceptional $56,709 |
| Immigrants | Ireland | 100.0 /100 | #9 | Exceptional $56,584 |
| Okinawans | 100.0 /100 | #10 | Exceptional $55,817 |
| Eastern Europeans | 100.0 /100 | #11 | Exceptional $55,780 |
| Immigrants | Sweden | 100.0 /100 | #12 | Exceptional $55,582 |
| Immigrants | India | 100.0 /100 | #13 | Exceptional $55,268 |
| Immigrants | Belgium | 100.0 /100 | #14 | Exceptional $55,082 |
| Cypriots | 100.0 /100 | #15 | Exceptional $54,899 |
| Immigrants | Switzerland | 100.0 /100 | #16 | Exceptional $54,866 |
| Immigrants | France | 100.0 /100 | #17 | Exceptional $54,557 |
| Thais | 100.0 /100 | #18 | Exceptional $54,307 |
| Immigrants | China | 100.0 /100 | #19 | Exceptional $54,264 |
| Soviet Union | 100.0 /100 | #20 | Exceptional $54,202 |