Luxembourger vs Immigrants from Guyana Female Disability
COMPARE
Luxembourger
Immigrants from Guyana
Female Disability
Female Disability Comparison
Luxembourgers
Immigrants from Guyana
11.6%
FEMALE DISABILITY
99.6/ 100
METRIC RATING
82nd/ 347
METRIC RANK
12.2%
FEMALE DISABILITY
43.1/ 100
METRIC RATING
176th/ 347
METRIC RANK
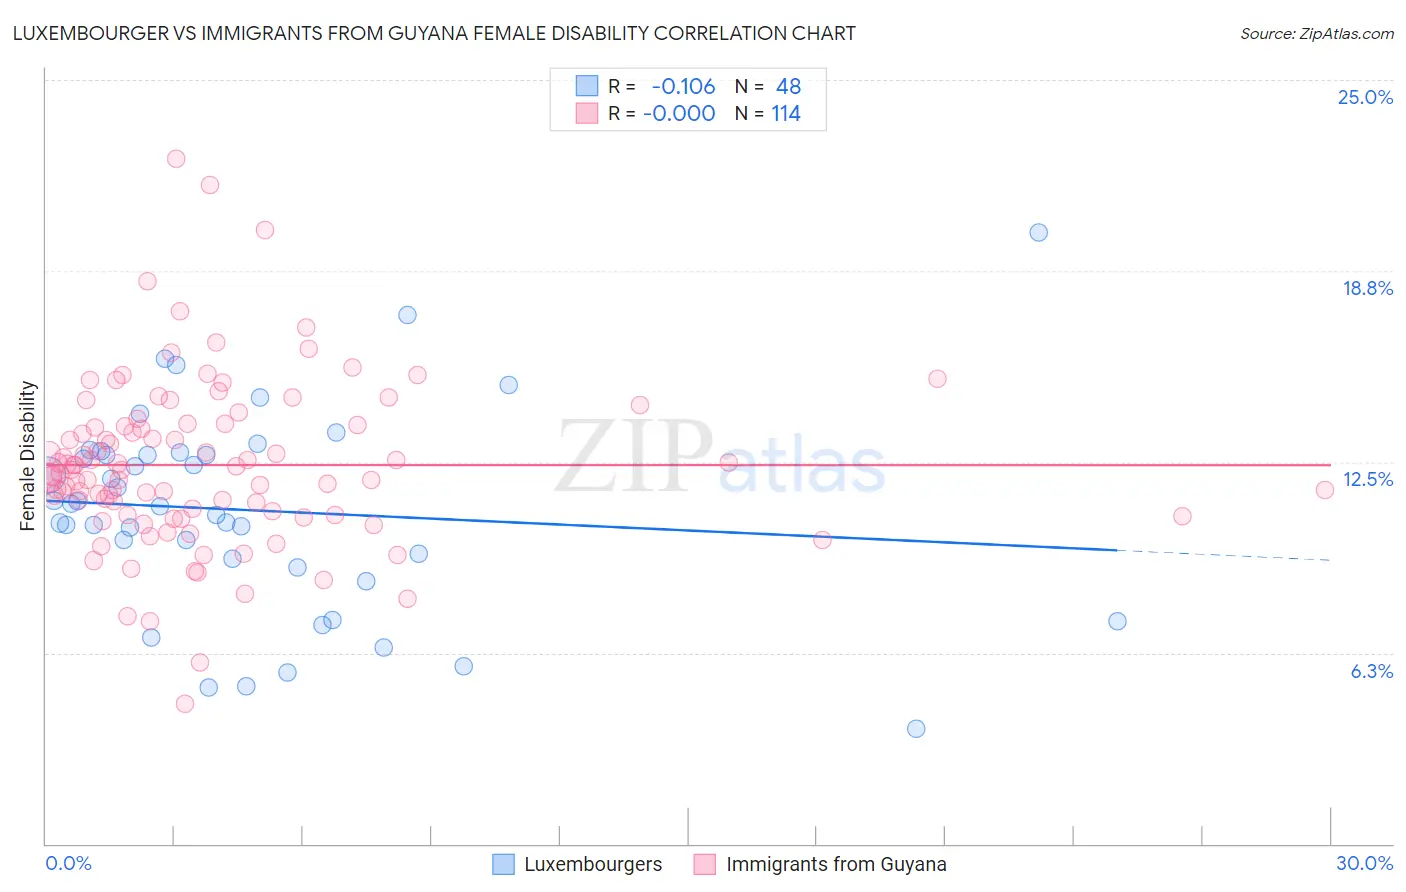
Luxembourger vs Immigrants from Guyana Female Disability Correlation Chart
The statistical analysis conducted on geographies consisting of 144,677,023 people shows a poor negative correlation between the proportion of Luxembourgers and percentage of females with a disability in the United States with a correlation coefficient (R) of -0.106 and weighted average of 11.6%. Similarly, the statistical analysis conducted on geographies consisting of 183,713,039 people shows no correlation between the proportion of Immigrants from Guyana and percentage of females with a disability in the United States with a correlation coefficient (R) of -0.000 and weighted average of 12.2%, a difference of 5.8%.
Female Disability Correlation Summary
| Measurement | Luxembourger | Immigrants from Guyana |
| Minimum | 3.8% | 4.6% |
| Maximum | 20.0% | 22.4% |
| Range | 16.2% | 17.8% |
| Mean | 10.9% | 12.4% |
| Median | 11.1% | 12.2% |
| Interquartile 25% (IQ1) | 9.2% | 10.8% |
| Interquartile 75% (IQ3) | 12.8% | 13.7% |
| Interquartile Range (IQR) | 3.6% | 2.9% |
| Standard Deviation (Sample) | 3.3% | 2.7% |
| Standard Deviation (Population) | 3.3% | 2.7% |
Similar Demographics by Female Disability
Demographics Similar to Luxembourgers by Female Disability
In terms of female disability, the demographic groups most similar to Luxembourgers are Immigrants from Serbia (11.6%, a difference of 0.020%), Immigrants from Poland (11.6%, a difference of 0.050%), Palestinian (11.6%, a difference of 0.080%), Immigrants from Cameroon (11.6%, a difference of 0.080%), and Immigrants from Denmark (11.6%, a difference of 0.15%).
| Demographics | Rating | Rank | Female Disability |
| Immigrants | Lebanon | 99.7 /100 | #75 | Exceptional 11.5% |
| Immigrants | Eritrea | 99.7 /100 | #76 | Exceptional 11.5% |
| Immigrants | Afghanistan | 99.7 /100 | #77 | Exceptional 11.5% |
| Immigrants | South Africa | 99.7 /100 | #78 | Exceptional 11.5% |
| Sierra Leoneans | 99.7 /100 | #79 | Exceptional 11.5% |
| Immigrants | Jordan | 99.7 /100 | #80 | Exceptional 11.5% |
| Eastern Europeans | 99.7 /100 | #81 | Exceptional 11.5% |
| Luxembourgers | 99.6 /100 | #82 | Exceptional 11.6% |
| Immigrants | Serbia | 99.6 /100 | #83 | Exceptional 11.6% |
| Immigrants | Poland | 99.6 /100 | #84 | Exceptional 11.6% |
| Palestinians | 99.6 /100 | #85 | Exceptional 11.6% |
| Immigrants | Cameroon | 99.6 /100 | #86 | Exceptional 11.6% |
| Immigrants | Denmark | 99.5 /100 | #87 | Exceptional 11.6% |
| Yup'ik | 99.5 /100 | #88 | Exceptional 11.6% |
| Vietnamese | 99.5 /100 | #89 | Exceptional 11.6% |
Demographics Similar to Immigrants from Guyana by Female Disability
In terms of female disability, the demographic groups most similar to Immigrants from Guyana are Immigrants from Ghana (12.2%, a difference of 0.030%), Immigrants from Western Europe (12.2%, a difference of 0.080%), Immigrants from Fiji (12.3%, a difference of 0.19%), Albanian (12.3%, a difference of 0.20%), and Immigrants from Canada (12.3%, a difference of 0.23%).
| Demographics | Rating | Rank | Female Disability |
| Lebanese | 58.1 /100 | #169 | Average 12.2% |
| Maltese | 57.0 /100 | #170 | Average 12.2% |
| Immigrants | Southern Europe | 56.3 /100 | #171 | Average 12.2% |
| Haitians | 51.9 /100 | #172 | Average 12.2% |
| Immigrants | Mexico | 50.8 /100 | #173 | Average 12.2% |
| Immigrants | England | 50.0 /100 | #174 | Average 12.2% |
| Immigrants | St. Vincent and the Grenadines | 49.7 /100 | #175 | Average 12.2% |
| Immigrants | Guyana | 43.1 /100 | #176 | Average 12.2% |
| Immigrants | Ghana | 42.5 /100 | #177 | Average 12.2% |
| Immigrants | Western Europe | 40.9 /100 | #178 | Average 12.2% |
| Immigrants | Fiji | 38.2 /100 | #179 | Fair 12.3% |
| Albanians | 37.9 /100 | #180 | Fair 12.3% |
| Immigrants | Canada | 37.2 /100 | #181 | Fair 12.3% |
| Norwegians | 36.9 /100 | #182 | Fair 12.3% |
| Cubans | 36.5 /100 | #183 | Fair 12.3% |