Lumbee vs Choctaw Per Capita Income
COMPARE
Lumbee
Choctaw
Per Capita Income
Per Capita Income Comparison
Lumbee
Choctaw
$29,845
PER CAPITA INCOME
0.0/ 100
METRIC RATING
346th/ 347
METRIC RANK
$35,999
PER CAPITA INCOME
0.0/ 100
METRIC RATING
316th/ 347
METRIC RANK
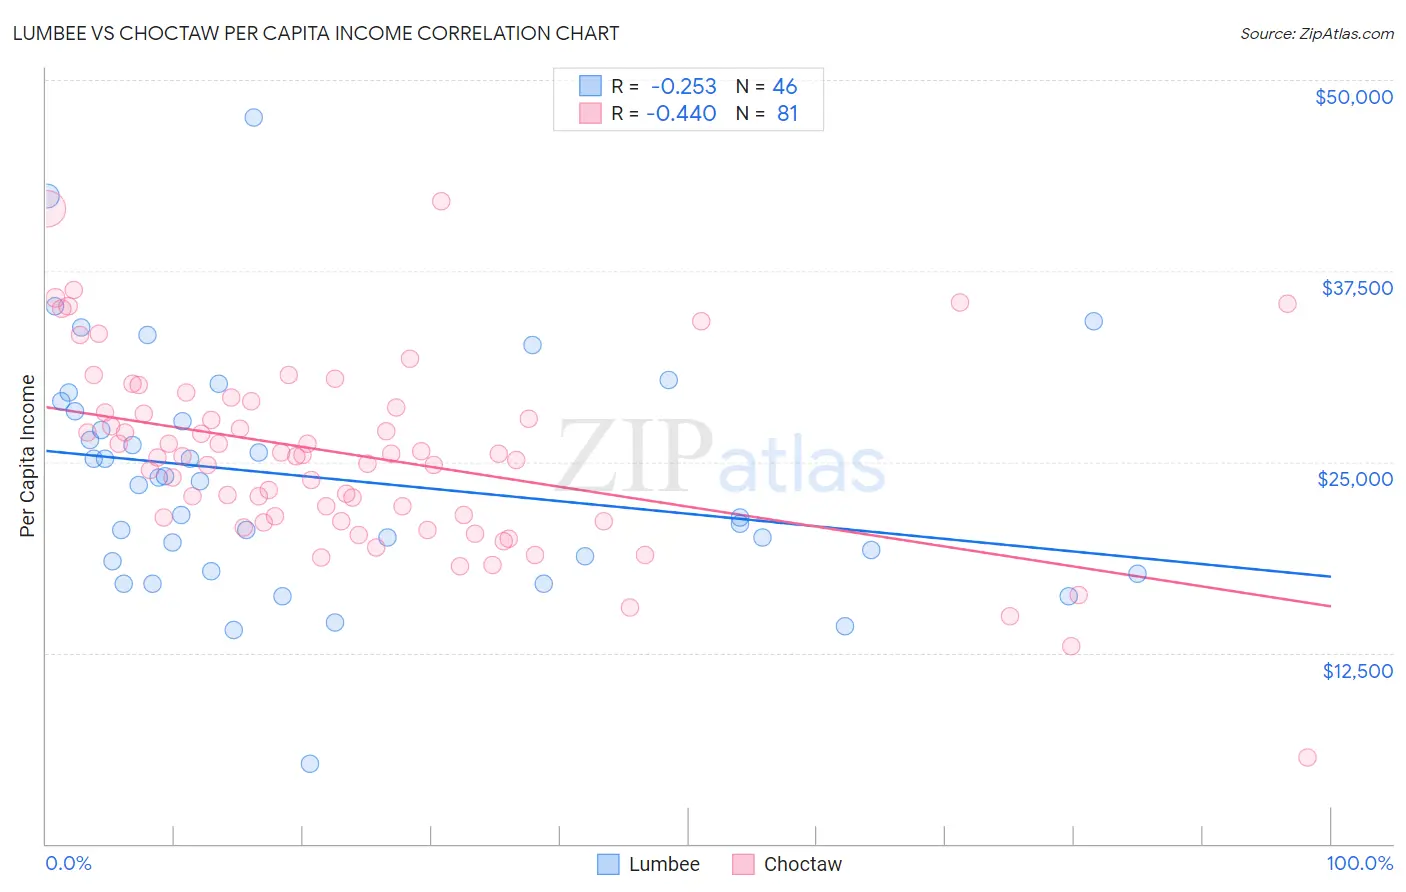
Lumbee vs Choctaw Per Capita Income Correlation Chart
The statistical analysis conducted on geographies consisting of 92,299,068 people shows a weak negative correlation between the proportion of Lumbee and per capita income in the United States with a correlation coefficient (R) of -0.253 and weighted average of $29,845. Similarly, the statistical analysis conducted on geographies consisting of 269,743,960 people shows a moderate negative correlation between the proportion of Choctaw and per capita income in the United States with a correlation coefficient (R) of -0.440 and weighted average of $35,999, a difference of 20.6%.
Per Capita Income Correlation Summary
| Measurement | Lumbee | Choctaw |
| Minimum | $5,266 | $5,606 |
| Maximum | $47,547 | $42,046 |
| Range | $42,281 | $36,440 |
| Mean | $23,880 | $25,429 |
| Median | $23,634 | $25,402 |
| Interquartile 25% (IQ1) | $18,484 | $21,238 |
| Interquartile 75% (IQ3) | $28,340 | $28,737 |
| Interquartile Range (IQR) | $9,856 | $7,499 |
| Standard Deviation (Sample) | $7,789 | $6,184 |
| Standard Deviation (Population) | $7,704 | $6,145 |
Similar Demographics by Per Capita Income
Demographics Similar to Lumbee by Per Capita Income
In terms of per capita income, the demographic groups most similar to Lumbee are Tohono O'odham ($30,256, a difference of 1.4%), Yup'ik ($30,518, a difference of 2.3%), Pima ($30,644, a difference of 2.7%), Navajo ($29,031, a difference of 2.8%), and Hopi ($31,177, a difference of 4.5%).
| Demographics | Rating | Rank | Per Capita Income |
| Immigrants | Yemen | 0.0 /100 | #333 | Tragic $33,696 |
| Natives/Alaskans | 0.0 /100 | #334 | Tragic $33,279 |
| Yuman | 0.0 /100 | #335 | Tragic $33,236 |
| Yakama | 0.0 /100 | #336 | Tragic $33,009 |
| Houma | 0.0 /100 | #337 | Tragic $32,996 |
| Arapaho | 0.0 /100 | #338 | Tragic $32,345 |
| Pueblo | 0.0 /100 | #339 | Tragic $32,012 |
| Crow | 0.0 /100 | #340 | Tragic $31,729 |
| Puerto Ricans | 0.0 /100 | #341 | Tragic $31,268 |
| Hopi | 0.0 /100 | #342 | Tragic $31,177 |
| Pima | 0.0 /100 | #343 | Tragic $30,644 |
| Yup'ik | 0.0 /100 | #344 | Tragic $30,518 |
| Tohono O'odham | 0.0 /100 | #345 | Tragic $30,256 |
| Lumbee | 0.0 /100 | #346 | Tragic $29,845 |
| Navajo | 0.0 /100 | #347 | Tragic $29,031 |
Demographics Similar to Choctaw by Per Capita Income
In terms of per capita income, the demographic groups most similar to Choctaw are Dutch West Indian ($35,922, a difference of 0.21%), Bangladeshi ($35,897, a difference of 0.28%), Yaqui ($36,112, a difference of 0.31%), Seminole ($36,180, a difference of 0.50%), and Immigrants from Congo ($35,720, a difference of 0.78%).
| Demographics | Rating | Rank | Per Capita Income |
| Immigrants | Honduras | 0.0 /100 | #309 | Tragic $36,665 |
| Ute | 0.0 /100 | #310 | Tragic $36,651 |
| Chippewa | 0.0 /100 | #311 | Tragic $36,631 |
| Chickasaw | 0.0 /100 | #312 | Tragic $36,475 |
| Bahamians | 0.0 /100 | #313 | Tragic $36,427 |
| Seminole | 0.0 /100 | #314 | Tragic $36,180 |
| Yaqui | 0.0 /100 | #315 | Tragic $36,112 |
| Choctaw | 0.0 /100 | #316 | Tragic $35,999 |
| Dutch West Indians | 0.0 /100 | #317 | Tragic $35,922 |
| Bangladeshis | 0.0 /100 | #318 | Tragic $35,897 |
| Immigrants | Congo | 0.0 /100 | #319 | Tragic $35,720 |
| Hispanics or Latinos | 0.0 /100 | #320 | Tragic $35,688 |
| Blacks/African Americans | 0.0 /100 | #321 | Tragic $35,564 |
| Creek | 0.0 /100 | #322 | Tragic $35,546 |
| Cheyenne | 0.0 /100 | #323 | Tragic $35,276 |