Lumbee vs Irish Per Capita Income
COMPARE
Lumbee
Irish
Per Capita Income
Per Capita Income Comparison
Lumbee
Irish
$29,845
PER CAPITA INCOME
0.0/ 100
METRIC RATING
346th/ 347
METRIC RANK
$44,679
PER CAPITA INCOME
75.8/ 100
METRIC RATING
146th/ 347
METRIC RANK
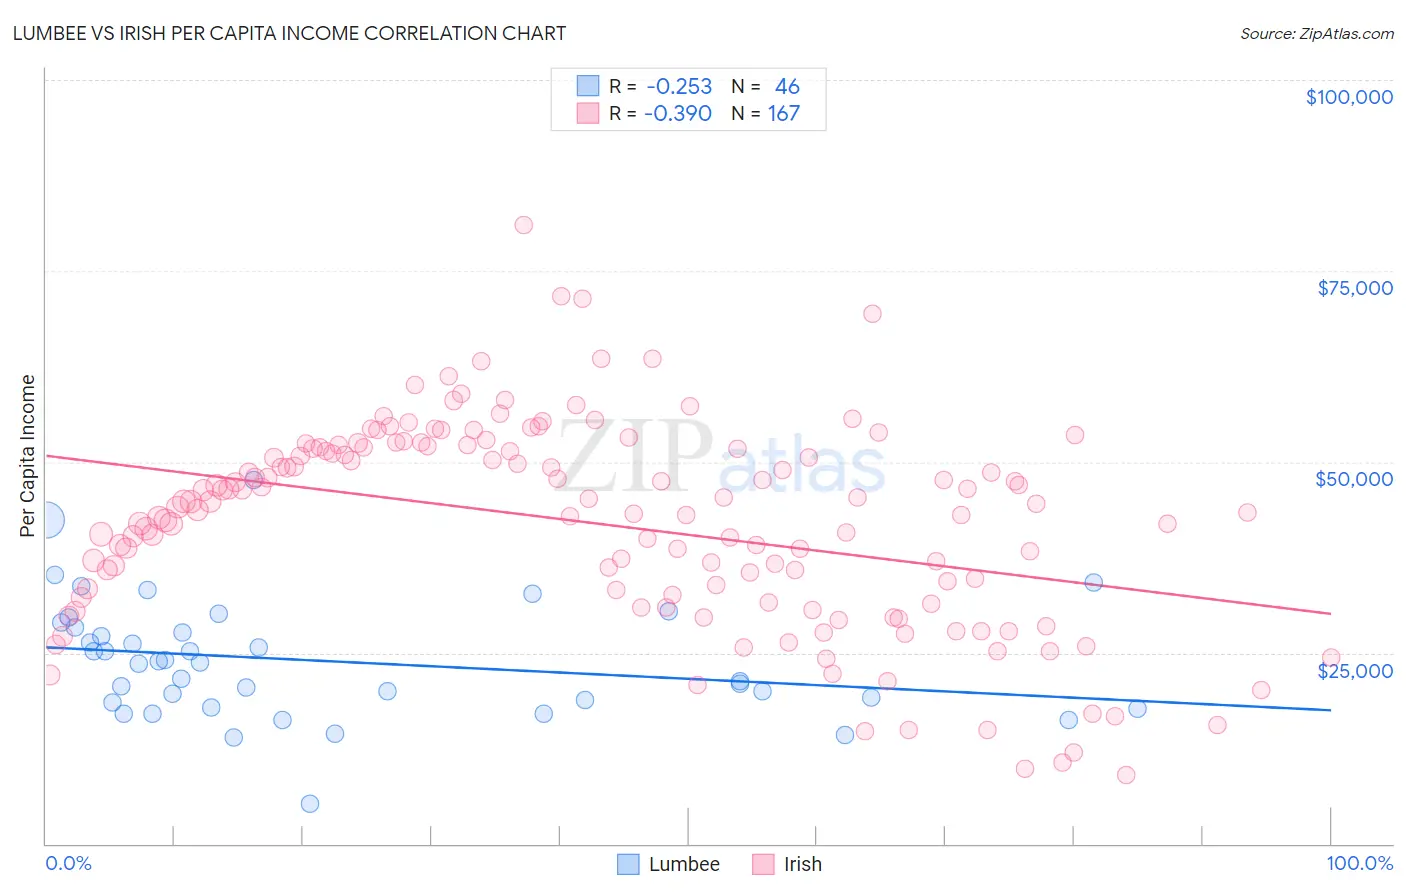
Lumbee vs Irish Per Capita Income Correlation Chart
The statistical analysis conducted on geographies consisting of 92,299,068 people shows a weak negative correlation between the proportion of Lumbee and per capita income in the United States with a correlation coefficient (R) of -0.253 and weighted average of $29,845. Similarly, the statistical analysis conducted on geographies consisting of 580,769,300 people shows a mild negative correlation between the proportion of Irish and per capita income in the United States with a correlation coefficient (R) of -0.390 and weighted average of $44,679, a difference of 49.7%.
Per Capita Income Correlation Summary
| Measurement | Lumbee | Irish |
| Minimum | $5,266 | $9,015 |
| Maximum | $47,547 | $80,942 |
| Range | $42,281 | $71,927 |
| Mean | $23,880 | $42,054 |
| Median | $23,634 | $44,449 |
| Interquartile 25% (IQ1) | $18,484 | $32,164 |
| Interquartile 75% (IQ3) | $28,340 | $51,890 |
| Interquartile Range (IQR) | $9,856 | $19,726 |
| Standard Deviation (Sample) | $7,789 | $13,324 |
| Standard Deviation (Population) | $7,704 | $13,284 |
Similar Demographics by Per Capita Income
Demographics Similar to Lumbee by Per Capita Income
In terms of per capita income, the demographic groups most similar to Lumbee are Tohono O'odham ($30,256, a difference of 1.4%), Yup'ik ($30,518, a difference of 2.3%), Pima ($30,644, a difference of 2.7%), Navajo ($29,031, a difference of 2.8%), and Hopi ($31,177, a difference of 4.5%).
| Demographics | Rating | Rank | Per Capita Income |
| Immigrants | Yemen | 0.0 /100 | #333 | Tragic $33,696 |
| Natives/Alaskans | 0.0 /100 | #334 | Tragic $33,279 |
| Yuman | 0.0 /100 | #335 | Tragic $33,236 |
| Yakama | 0.0 /100 | #336 | Tragic $33,009 |
| Houma | 0.0 /100 | #337 | Tragic $32,996 |
| Arapaho | 0.0 /100 | #338 | Tragic $32,345 |
| Pueblo | 0.0 /100 | #339 | Tragic $32,012 |
| Crow | 0.0 /100 | #340 | Tragic $31,729 |
| Puerto Ricans | 0.0 /100 | #341 | Tragic $31,268 |
| Hopi | 0.0 /100 | #342 | Tragic $31,177 |
| Pima | 0.0 /100 | #343 | Tragic $30,644 |
| Yup'ik | 0.0 /100 | #344 | Tragic $30,518 |
| Tohono O'odham | 0.0 /100 | #345 | Tragic $30,256 |
| Lumbee | 0.0 /100 | #346 | Tragic $29,845 |
| Navajo | 0.0 /100 | #347 | Tragic $29,031 |
Demographics Similar to Irish by Per Capita Income
In terms of per capita income, the demographic groups most similar to Irish are Czech ($44,595, a difference of 0.19%), Immigrants from Afghanistan ($44,790, a difference of 0.25%), Immigrants from Armenia ($44,552, a difference of 0.28%), Korean ($44,522, a difference of 0.35%), and Immigrants from Eritrea ($44,509, a difference of 0.38%).
| Demographics | Rating | Rank | Per Capita Income |
| Basques | 83.2 /100 | #139 | Excellent $45,086 |
| Immigrants | Jordan | 82.9 /100 | #140 | Excellent $45,066 |
| Slavs | 82.6 /100 | #141 | Excellent $45,049 |
| Ugandans | 82.6 /100 | #142 | Excellent $45,047 |
| Immigrants | Uganda | 82.5 /100 | #143 | Excellent $45,043 |
| Icelanders | 81.6 /100 | #144 | Excellent $44,987 |
| Immigrants | Afghanistan | 78.0 /100 | #145 | Good $44,790 |
| Irish | 75.8 /100 | #146 | Good $44,679 |
| Czechs | 74.1 /100 | #147 | Good $44,595 |
| Immigrants | Armenia | 73.1 /100 | #148 | Good $44,552 |
| Koreans | 72.5 /100 | #149 | Good $44,522 |
| Immigrants | Eritrea | 72.1 /100 | #150 | Good $44,509 |
| Norwegians | 71.5 /100 | #151 | Good $44,480 |
| Peruvians | 71.5 /100 | #152 | Good $44,479 |
| Scottish | 70.6 /100 | #153 | Good $44,440 |