Belizean vs Choctaw Per Capita Income
COMPARE
Belizean
Choctaw
Per Capita Income
Per Capita Income Comparison
Belizeans
Choctaw
$39,097
PER CAPITA INCOME
0.6/ 100
METRIC RATING
263rd/ 347
METRIC RANK
$35,999
PER CAPITA INCOME
0.0/ 100
METRIC RATING
316th/ 347
METRIC RANK
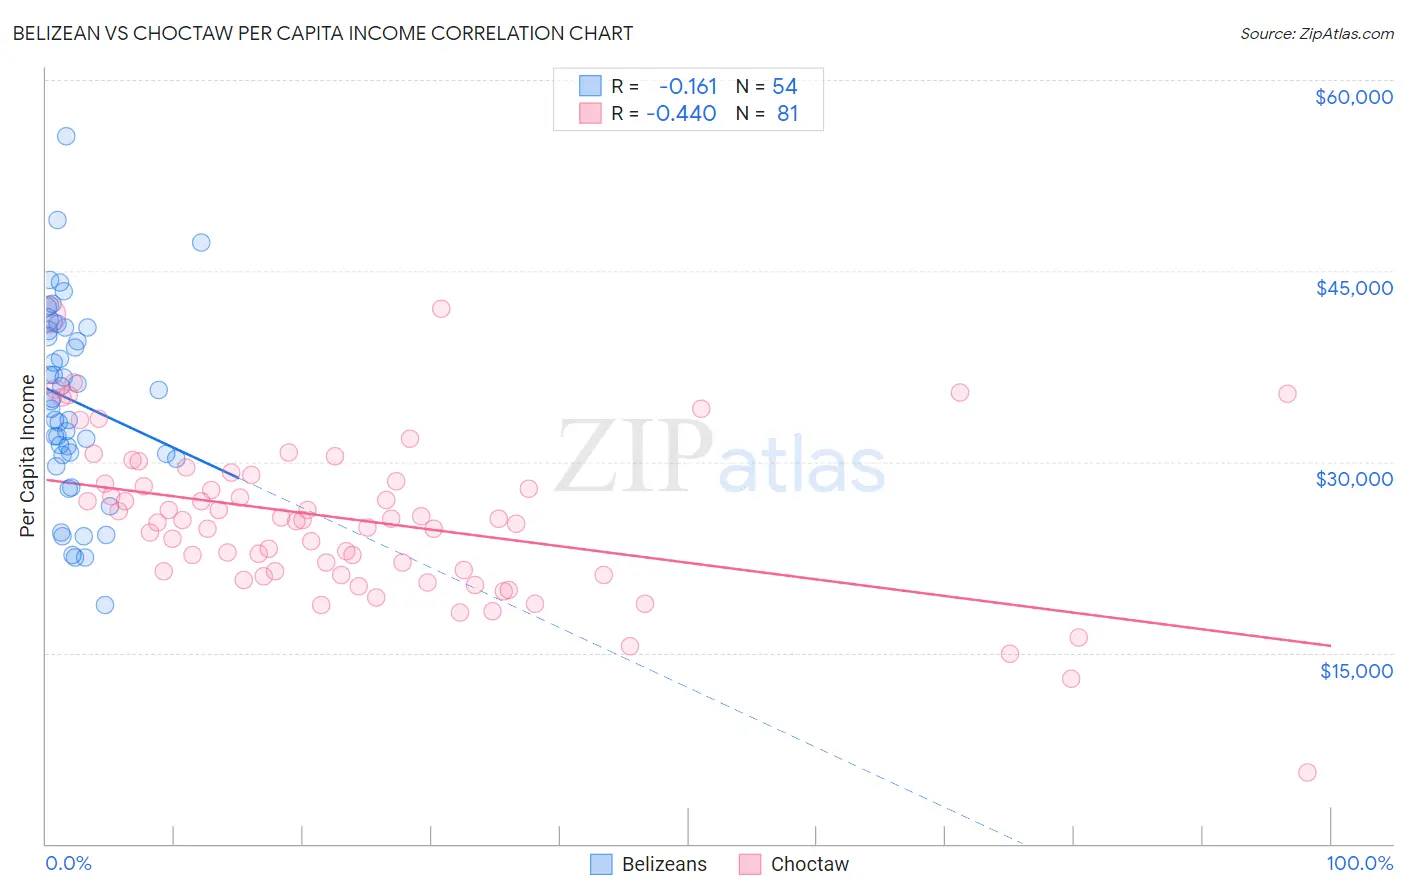
Belizean vs Choctaw Per Capita Income Correlation Chart
The statistical analysis conducted on geographies consisting of 144,225,006 people shows a poor negative correlation between the proportion of Belizeans and per capita income in the United States with a correlation coefficient (R) of -0.161 and weighted average of $39,097. Similarly, the statistical analysis conducted on geographies consisting of 269,743,960 people shows a moderate negative correlation between the proportion of Choctaw and per capita income in the United States with a correlation coefficient (R) of -0.440 and weighted average of $35,999, a difference of 8.6%.
Per Capita Income Correlation Summary
| Measurement | Belizean | Choctaw |
| Minimum | $18,752 | $5,606 |
| Maximum | $55,551 | $42,046 |
| Range | $36,799 | $36,440 |
| Mean | $34,798 | $25,429 |
| Median | $34,873 | $25,402 |
| Interquartile 25% (IQ1) | $30,514 | $21,238 |
| Interquartile 75% (IQ3) | $40,555 | $28,737 |
| Interquartile Range (IQR) | $10,041 | $7,499 |
| Standard Deviation (Sample) | $7,514 | $6,184 |
| Standard Deviation (Population) | $7,444 | $6,145 |
Similar Demographics by Per Capita Income
Demographics Similar to Belizeans by Per Capita Income
In terms of per capita income, the demographic groups most similar to Belizeans are Iroquois ($39,104, a difference of 0.020%), Marshallese ($39,108, a difference of 0.030%), American ($39,039, a difference of 0.15%), Alaskan Athabascan ($39,163, a difference of 0.17%), and Spanish American ($39,012, a difference of 0.22%).
| Demographics | Rating | Rank | Per Capita Income |
| Hawaiians | 0.8 /100 | #256 | Tragic $39,403 |
| Nicaraguans | 0.8 /100 | #257 | Tragic $39,372 |
| Jamaicans | 0.7 /100 | #258 | Tragic $39,231 |
| Malaysians | 0.7 /100 | #259 | Tragic $39,194 |
| Alaskan Athabascans | 0.6 /100 | #260 | Tragic $39,163 |
| Marshallese | 0.6 /100 | #261 | Tragic $39,108 |
| Iroquois | 0.6 /100 | #262 | Tragic $39,104 |
| Belizeans | 0.6 /100 | #263 | Tragic $39,097 |
| Americans | 0.6 /100 | #264 | Tragic $39,039 |
| Spanish Americans | 0.5 /100 | #265 | Tragic $39,012 |
| Salvadorans | 0.5 /100 | #266 | Tragic $38,858 |
| Immigrants | Zaire | 0.4 /100 | #267 | Tragic $38,848 |
| Liberians | 0.4 /100 | #268 | Tragic $38,780 |
| Immigrants | Jamaica | 0.4 /100 | #269 | Tragic $38,766 |
| Immigrants | Belize | 0.3 /100 | #270 | Tragic $38,614 |
Demographics Similar to Choctaw by Per Capita Income
In terms of per capita income, the demographic groups most similar to Choctaw are Dutch West Indian ($35,922, a difference of 0.21%), Bangladeshi ($35,897, a difference of 0.28%), Yaqui ($36,112, a difference of 0.31%), Seminole ($36,180, a difference of 0.50%), and Immigrants from Congo ($35,720, a difference of 0.78%).
| Demographics | Rating | Rank | Per Capita Income |
| Immigrants | Honduras | 0.0 /100 | #309 | Tragic $36,665 |
| Ute | 0.0 /100 | #310 | Tragic $36,651 |
| Chippewa | 0.0 /100 | #311 | Tragic $36,631 |
| Chickasaw | 0.0 /100 | #312 | Tragic $36,475 |
| Bahamians | 0.0 /100 | #313 | Tragic $36,427 |
| Seminole | 0.0 /100 | #314 | Tragic $36,180 |
| Yaqui | 0.0 /100 | #315 | Tragic $36,112 |
| Choctaw | 0.0 /100 | #316 | Tragic $35,999 |
| Dutch West Indians | 0.0 /100 | #317 | Tragic $35,922 |
| Bangladeshis | 0.0 /100 | #318 | Tragic $35,897 |
| Immigrants | Congo | 0.0 /100 | #319 | Tragic $35,720 |
| Hispanics or Latinos | 0.0 /100 | #320 | Tragic $35,688 |
| Blacks/African Americans | 0.0 /100 | #321 | Tragic $35,564 |
| Creek | 0.0 /100 | #322 | Tragic $35,546 |
| Cheyenne | 0.0 /100 | #323 | Tragic $35,276 |