Lumbee vs Puget Sound Salish Per Capita Income
COMPARE
Lumbee
Puget Sound Salish
Per Capita Income
Per Capita Income Comparison
Lumbee
Puget Sound Salish
$29,845
PER CAPITA INCOME
0.0/ 100
METRIC RATING
346th/ 347
METRIC RANK
$41,495
PER CAPITA INCOME
8.1/ 100
METRIC RATING
219th/ 347
METRIC RANK
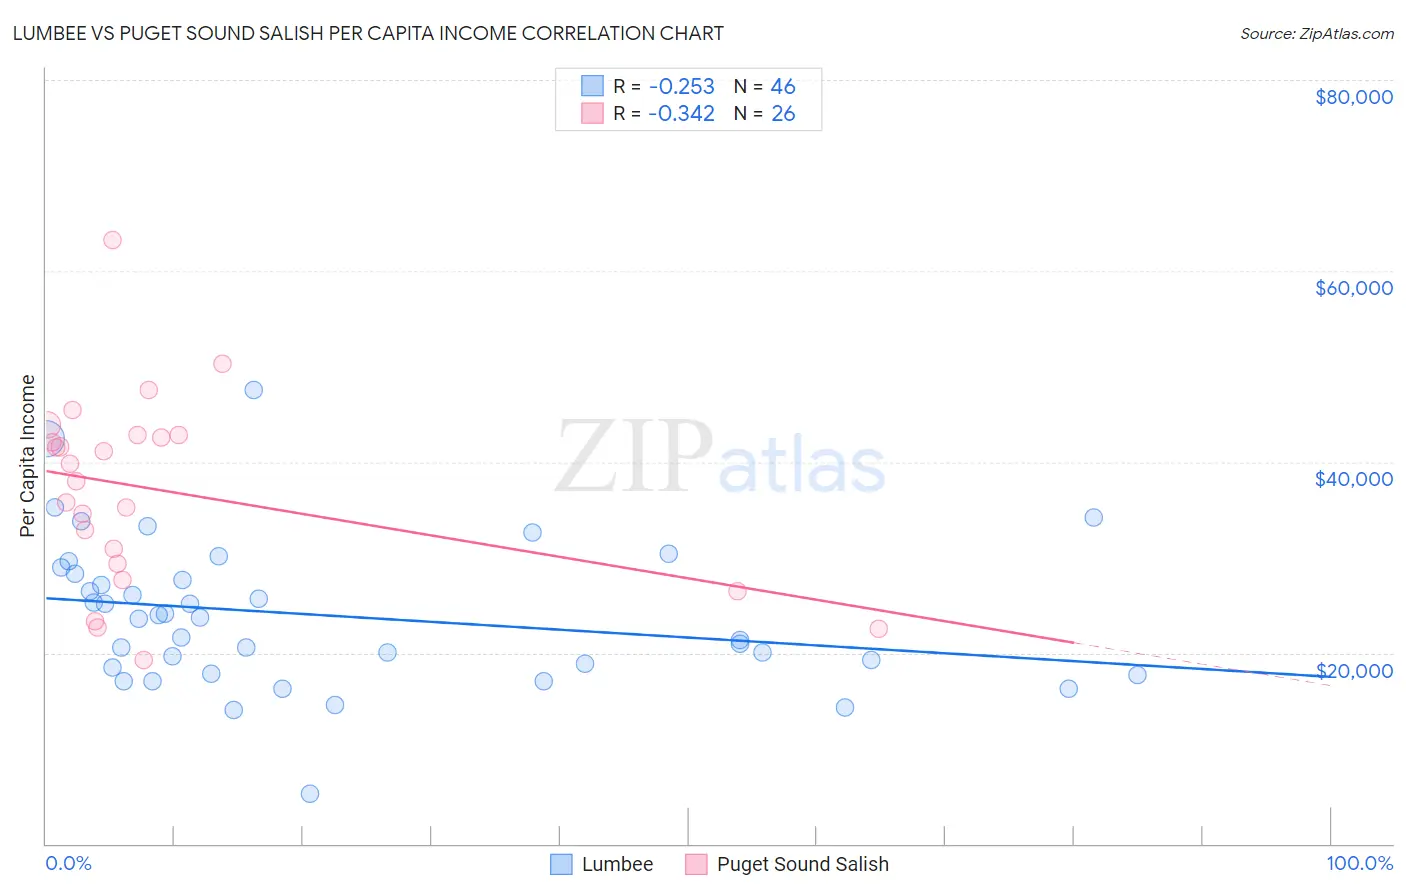
Lumbee vs Puget Sound Salish Per Capita Income Correlation Chart
The statistical analysis conducted on geographies consisting of 92,299,068 people shows a weak negative correlation between the proportion of Lumbee and per capita income in the United States with a correlation coefficient (R) of -0.253 and weighted average of $29,845. Similarly, the statistical analysis conducted on geographies consisting of 46,155,865 people shows a mild negative correlation between the proportion of Puget Sound Salish and per capita income in the United States with a correlation coefficient (R) of -0.342 and weighted average of $41,495, a difference of 39.0%.
Per Capita Income Correlation Summary
| Measurement | Lumbee | Puget Sound Salish |
| Minimum | $5,266 | $19,247 |
| Maximum | $47,547 | $63,213 |
| Range | $42,281 | $43,966 |
| Mean | $23,880 | $37,040 |
| Median | $23,634 | $38,913 |
| Interquartile 25% (IQ1) | $18,484 | $29,363 |
| Interquartile 75% (IQ3) | $28,340 | $42,776 |
| Interquartile Range (IQR) | $9,856 | $13,413 |
| Standard Deviation (Sample) | $7,789 | $10,042 |
| Standard Deviation (Population) | $7,704 | $9,847 |
Similar Demographics by Per Capita Income
Demographics Similar to Lumbee by Per Capita Income
In terms of per capita income, the demographic groups most similar to Lumbee are Tohono O'odham ($30,256, a difference of 1.4%), Yup'ik ($30,518, a difference of 2.3%), Pima ($30,644, a difference of 2.7%), Navajo ($29,031, a difference of 2.8%), and Hopi ($31,177, a difference of 4.5%).
| Demographics | Rating | Rank | Per Capita Income |
| Immigrants | Yemen | 0.0 /100 | #333 | Tragic $33,696 |
| Natives/Alaskans | 0.0 /100 | #334 | Tragic $33,279 |
| Yuman | 0.0 /100 | #335 | Tragic $33,236 |
| Yakama | 0.0 /100 | #336 | Tragic $33,009 |
| Houma | 0.0 /100 | #337 | Tragic $32,996 |
| Arapaho | 0.0 /100 | #338 | Tragic $32,345 |
| Pueblo | 0.0 /100 | #339 | Tragic $32,012 |
| Crow | 0.0 /100 | #340 | Tragic $31,729 |
| Puerto Ricans | 0.0 /100 | #341 | Tragic $31,268 |
| Hopi | 0.0 /100 | #342 | Tragic $31,177 |
| Pima | 0.0 /100 | #343 | Tragic $30,644 |
| Yup'ik | 0.0 /100 | #344 | Tragic $30,518 |
| Tohono O'odham | 0.0 /100 | #345 | Tragic $30,256 |
| Lumbee | 0.0 /100 | #346 | Tragic $29,845 |
| Navajo | 0.0 /100 | #347 | Tragic $29,031 |
Demographics Similar to Puget Sound Salish by Per Capita Income
In terms of per capita income, the demographic groups most similar to Puget Sound Salish are Immigrants from Barbados ($41,478, a difference of 0.040%), Immigrants from Trinidad and Tobago ($41,476, a difference of 0.040%), Immigrants from Iraq ($41,365, a difference of 0.31%), Trinidadian and Tobagonian ($41,655, a difference of 0.39%), and Immigrants from Cameroon ($41,334, a difference of 0.39%).
| Demographics | Rating | Rank | Per Capita Income |
| Immigrants | Senegal | 11.3 /100 | #212 | Poor $41,830 |
| Immigrants | Venezuela | 10.2 /100 | #213 | Poor $41,727 |
| Immigrants | Bangladesh | 10.1 /100 | #214 | Poor $41,709 |
| Sudanese | 9.9 /100 | #215 | Tragic $41,695 |
| Tongans | 9.9 /100 | #216 | Tragic $41,693 |
| Guamanians/Chamorros | 9.7 /100 | #217 | Tragic $41,678 |
| Trinidadians and Tobagonians | 9.5 /100 | #218 | Tragic $41,655 |
| Puget Sound Salish | 8.1 /100 | #219 | Tragic $41,495 |
| Immigrants | Barbados | 7.9 /100 | #220 | Tragic $41,478 |
| Immigrants | Trinidad and Tobago | 7.9 /100 | #221 | Tragic $41,476 |
| Immigrants | Iraq | 7.1 /100 | #222 | Tragic $41,365 |
| Immigrants | Cameroon | 6.8 /100 | #223 | Tragic $41,334 |
| Immigrants | St. Vincent and the Grenadines | 6.4 /100 | #224 | Tragic $41,270 |
| West Indians | 6.0 /100 | #225 | Tragic $41,217 |
| Immigrants | Ecuador | 5.9 /100 | #226 | Tragic $41,195 |