Yakama vs Choctaw Per Capita Income
COMPARE
Yakama
Choctaw
Per Capita Income
Per Capita Income Comparison
Yakama
Choctaw
$33,009
PER CAPITA INCOME
0.0/ 100
METRIC RATING
336th/ 347
METRIC RANK
$35,999
PER CAPITA INCOME
0.0/ 100
METRIC RATING
316th/ 347
METRIC RANK
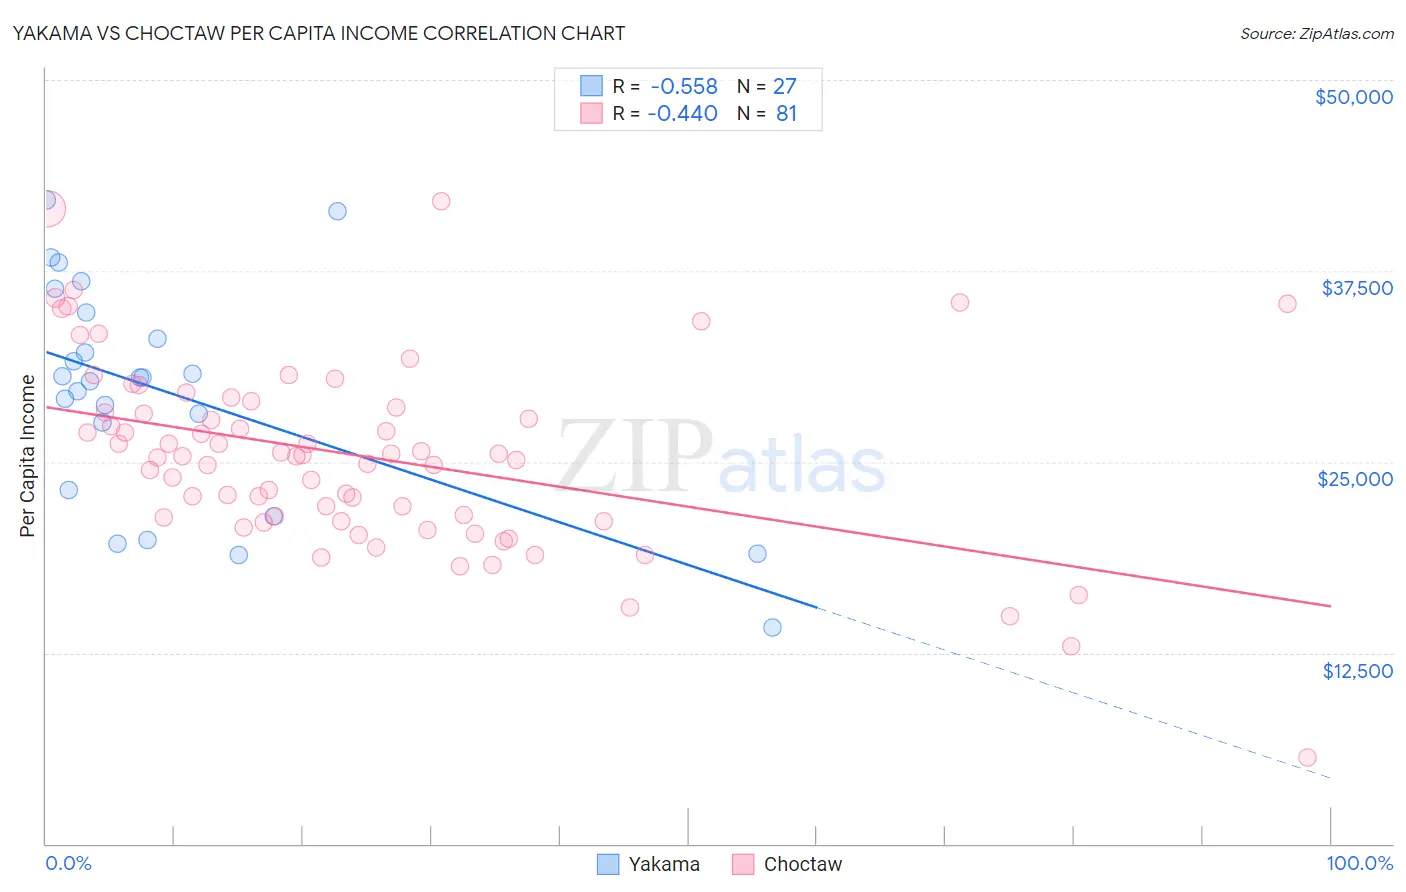
Yakama vs Choctaw Per Capita Income Correlation Chart
The statistical analysis conducted on geographies consisting of 19,923,144 people shows a substantial negative correlation between the proportion of Yakama and per capita income in the United States with a correlation coefficient (R) of -0.558 and weighted average of $33,009. Similarly, the statistical analysis conducted on geographies consisting of 269,743,960 people shows a moderate negative correlation between the proportion of Choctaw and per capita income in the United States with a correlation coefficient (R) of -0.440 and weighted average of $35,999, a difference of 9.1%.
Per Capita Income Correlation Summary
| Measurement | Yakama | Choctaw |
| Minimum | $14,175 | $5,606 |
| Maximum | $42,131 | $42,046 |
| Range | $27,956 | $36,440 |
| Mean | $29,512 | $25,429 |
| Median | $30,514 | $25,402 |
| Interquartile 25% (IQ1) | $23,165 | $21,238 |
| Interquartile 75% (IQ3) | $34,761 | $28,737 |
| Interquartile Range (IQR) | $11,597 | $7,499 |
| Standard Deviation (Sample) | $7,251 | $6,184 |
| Standard Deviation (Population) | $7,116 | $6,145 |
Demographics Similar to Yakama and Choctaw by Per Capita Income
In terms of per capita income, the demographic groups most similar to Yakama are Yuman ($33,236, a difference of 0.69%), Native/Alaskan ($33,279, a difference of 0.82%), Immigrants from Yemen ($33,696, a difference of 2.1%), Sioux ($33,921, a difference of 2.8%), and Immigrants from Mexico ($33,931, a difference of 2.8%). Similarly, the demographic groups most similar to Choctaw are Dutch West Indian ($35,922, a difference of 0.21%), Bangladeshi ($35,897, a difference of 0.28%), Immigrants from Congo ($35,720, a difference of 0.78%), Hispanic or Latino ($35,688, a difference of 0.87%), and Black/African American ($35,564, a difference of 1.2%).
| Demographics | Rating | Rank | Per Capita Income |
| Choctaw | 0.0 /100 | #316 | Tragic $35,999 |
| Dutch West Indians | 0.0 /100 | #317 | Tragic $35,922 |
| Bangladeshis | 0.0 /100 | #318 | Tragic $35,897 |
| Immigrants | Congo | 0.0 /100 | #319 | Tragic $35,720 |
| Hispanics or Latinos | 0.0 /100 | #320 | Tragic $35,688 |
| Blacks/African Americans | 0.0 /100 | #321 | Tragic $35,564 |
| Creek | 0.0 /100 | #322 | Tragic $35,546 |
| Cheyenne | 0.0 /100 | #323 | Tragic $35,276 |
| Kiowa | 0.0 /100 | #324 | Tragic $35,102 |
| Immigrants | Central America | 0.0 /100 | #325 | Tragic $34,974 |
| Immigrants | Cuba | 0.0 /100 | #326 | Tragic $34,910 |
| Apache | 0.0 /100 | #327 | Tragic $34,886 |
| Menominee | 0.0 /100 | #328 | Tragic $34,578 |
| Mexicans | 0.0 /100 | #329 | Tragic $34,559 |
| Spanish American Indians | 0.0 /100 | #330 | Tragic $34,195 |
| Immigrants | Mexico | 0.0 /100 | #331 | Tragic $33,931 |
| Sioux | 0.0 /100 | #332 | Tragic $33,921 |
| Immigrants | Yemen | 0.0 /100 | #333 | Tragic $33,696 |
| Natives/Alaskans | 0.0 /100 | #334 | Tragic $33,279 |
| Yuman | 0.0 /100 | #335 | Tragic $33,236 |
| Yakama | 0.0 /100 | #336 | Tragic $33,009 |