Lumbee vs Celtic Per Capita Income
COMPARE
Lumbee
Celtic
Per Capita Income
Per Capita Income Comparison
Lumbee
Celtics
$29,845
PER CAPITA INCOME
0.0/ 100
METRIC RATING
346th/ 347
METRIC RANK
$43,621
PER CAPITA INCOME
48.9/ 100
METRIC RATING
175th/ 347
METRIC RANK
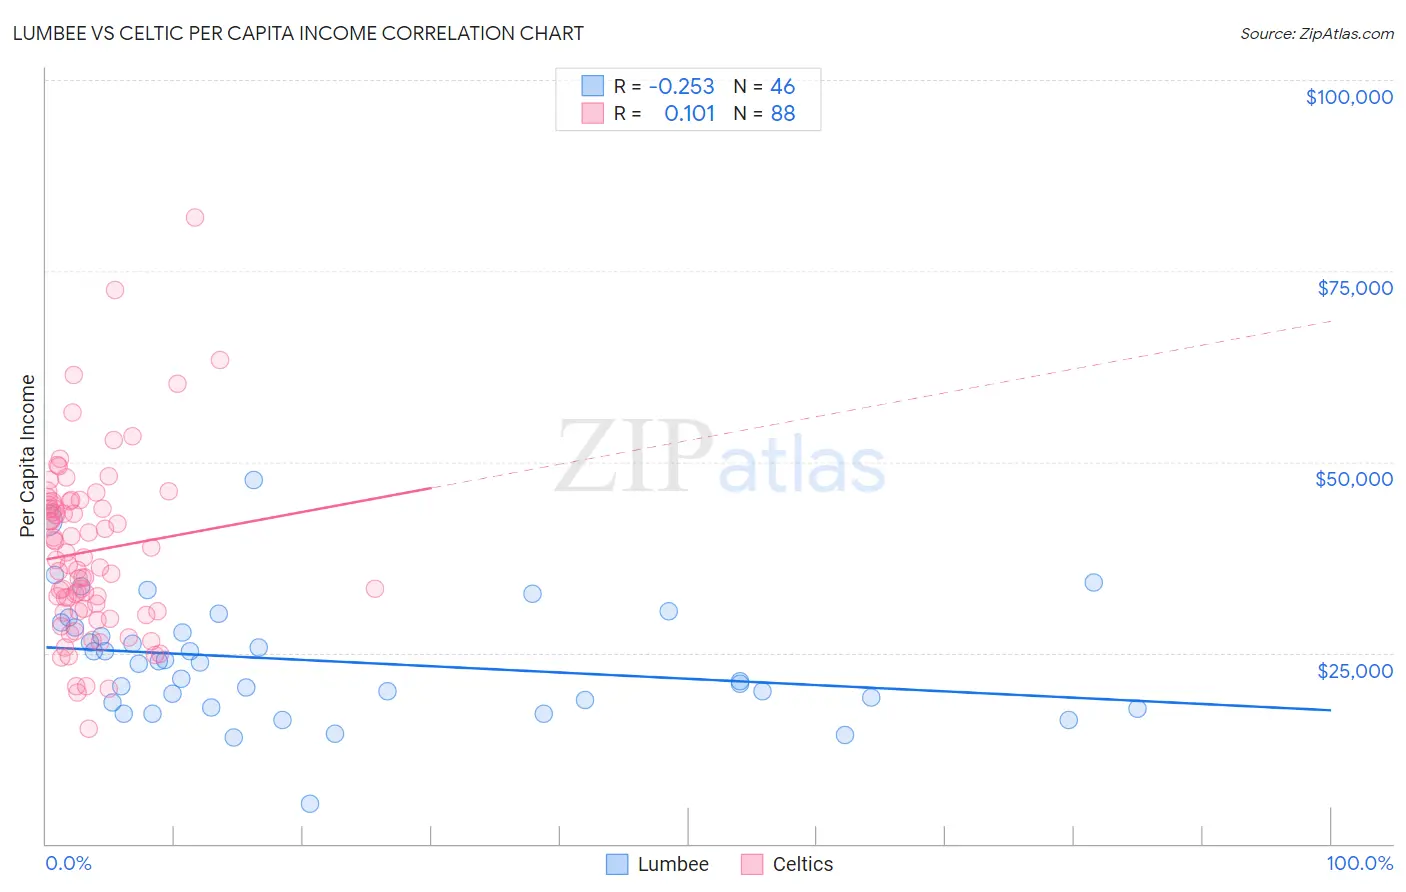
Lumbee vs Celtic Per Capita Income Correlation Chart
The statistical analysis conducted on geographies consisting of 92,299,068 people shows a weak negative correlation between the proportion of Lumbee and per capita income in the United States with a correlation coefficient (R) of -0.253 and weighted average of $29,845. Similarly, the statistical analysis conducted on geographies consisting of 168,877,272 people shows a poor positive correlation between the proportion of Celtics and per capita income in the United States with a correlation coefficient (R) of 0.101 and weighted average of $43,621, a difference of 46.2%.
Per Capita Income Correlation Summary
| Measurement | Lumbee | Celtic |
| Minimum | $5,266 | $15,033 |
| Maximum | $47,547 | $81,943 |
| Range | $42,281 | $66,910 |
| Mean | $23,880 | $38,287 |
| Median | $23,634 | $36,864 |
| Interquartile 25% (IQ1) | $18,484 | $30,511 |
| Interquartile 75% (IQ3) | $28,340 | $44,540 |
| Interquartile Range (IQR) | $9,856 | $14,029 |
| Standard Deviation (Sample) | $7,789 | $11,448 |
| Standard Deviation (Population) | $7,704 | $11,383 |
Similar Demographics by Per Capita Income
Demographics Similar to Lumbee by Per Capita Income
In terms of per capita income, the demographic groups most similar to Lumbee are Tohono O'odham ($30,256, a difference of 1.4%), Yup'ik ($30,518, a difference of 2.3%), Pima ($30,644, a difference of 2.7%), Navajo ($29,031, a difference of 2.8%), and Hopi ($31,177, a difference of 4.5%).
| Demographics | Rating | Rank | Per Capita Income |
| Immigrants | Yemen | 0.0 /100 | #333 | Tragic $33,696 |
| Natives/Alaskans | 0.0 /100 | #334 | Tragic $33,279 |
| Yuman | 0.0 /100 | #335 | Tragic $33,236 |
| Yakama | 0.0 /100 | #336 | Tragic $33,009 |
| Houma | 0.0 /100 | #337 | Tragic $32,996 |
| Arapaho | 0.0 /100 | #338 | Tragic $32,345 |
| Pueblo | 0.0 /100 | #339 | Tragic $32,012 |
| Crow | 0.0 /100 | #340 | Tragic $31,729 |
| Puerto Ricans | 0.0 /100 | #341 | Tragic $31,268 |
| Hopi | 0.0 /100 | #342 | Tragic $31,177 |
| Pima | 0.0 /100 | #343 | Tragic $30,644 |
| Yup'ik | 0.0 /100 | #344 | Tragic $30,518 |
| Tohono O'odham | 0.0 /100 | #345 | Tragic $30,256 |
| Lumbee | 0.0 /100 | #346 | Tragic $29,845 |
| Navajo | 0.0 /100 | #347 | Tragic $29,031 |
Demographics Similar to Celtics by Per Capita Income
In terms of per capita income, the demographic groups most similar to Celtics are Colombian ($43,661, a difference of 0.090%), French ($43,685, a difference of 0.15%), Immigrants from South Eastern Asia ($43,539, a difference of 0.19%), Tlingit-Haida ($43,516, a difference of 0.24%), and Immigrants from Costa Rica ($43,464, a difference of 0.36%).
| Demographics | Rating | Rank | Per Capita Income |
| Belgians | 58.1 /100 | #168 | Average $43,951 |
| Immigrants | Peru | 55.3 /100 | #169 | Average $43,852 |
| Scandinavians | 55.2 /100 | #170 | Average $43,848 |
| Immigrants | Eastern Africa | 54.9 /100 | #171 | Average $43,838 |
| Czechoslovakians | 54.1 /100 | #172 | Average $43,806 |
| French | 50.7 /100 | #173 | Average $43,685 |
| Colombians | 50.0 /100 | #174 | Average $43,661 |
| Celtics | 48.9 /100 | #175 | Average $43,621 |
| Immigrants | South Eastern Asia | 46.6 /100 | #176 | Average $43,539 |
| Tlingit-Haida | 45.9 /100 | #177 | Average $43,516 |
| Immigrants | Costa Rica | 44.5 /100 | #178 | Average $43,464 |
| Finns | 44.4 /100 | #179 | Average $43,461 |
| Sierra Leoneans | 42.9 /100 | #180 | Average $43,405 |
| Welsh | 38.2 /100 | #181 | Fair $43,233 |
| Immigrants | Vietnam | 38.1 /100 | #182 | Fair $43,229 |