Lumbee vs Albanian Per Capita Income
COMPARE
Lumbee
Albanian
Per Capita Income
Per Capita Income Comparison
Lumbee
Albanians
$29,845
PER CAPITA INCOME
0.0/ 100
METRIC RATING
346th/ 347
METRIC RANK
$47,379
PER CAPITA INCOME
98.5/ 100
METRIC RATING
94th/ 347
METRIC RANK
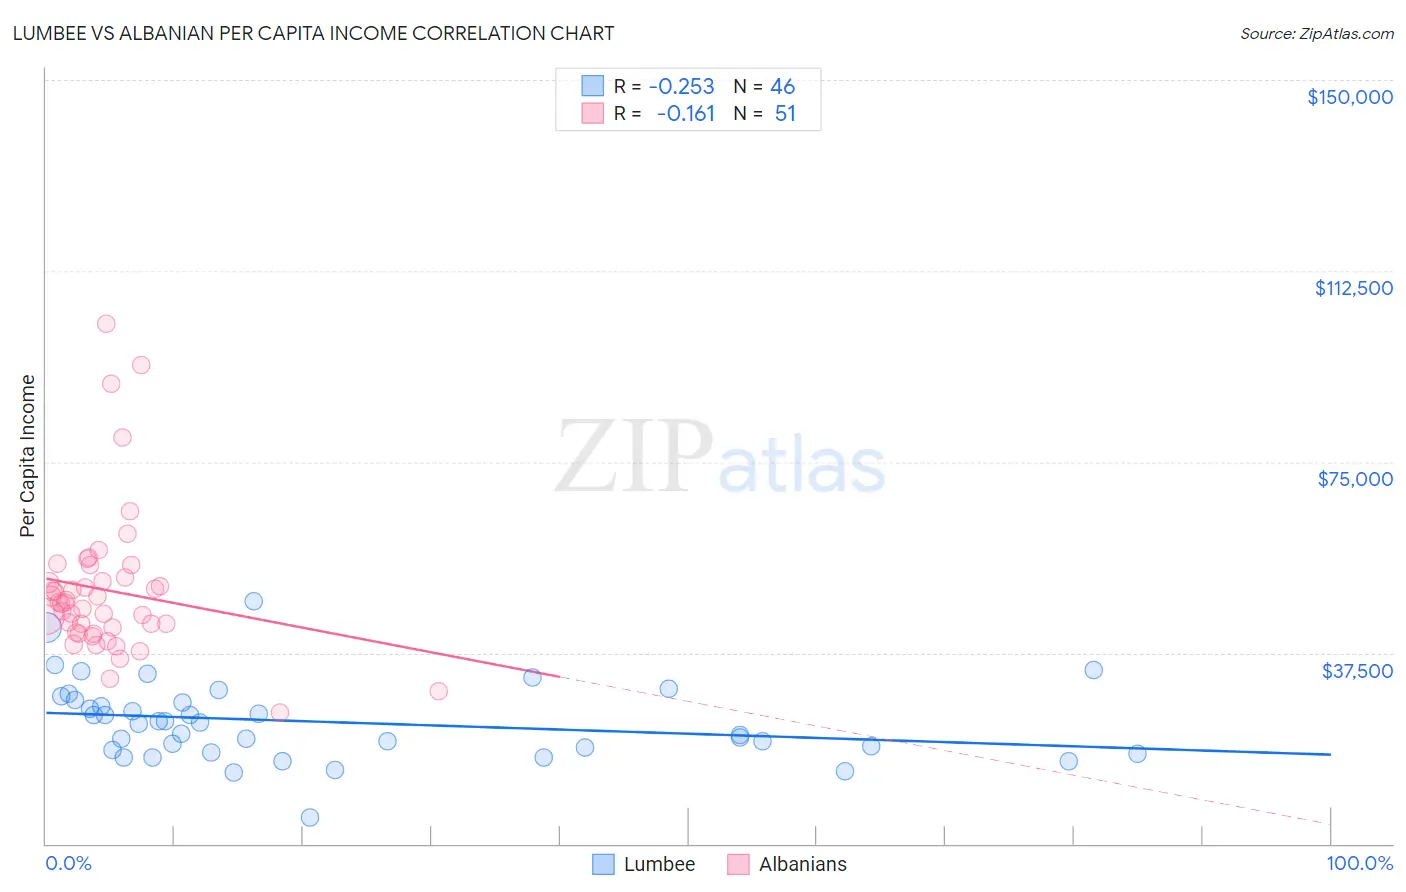
Lumbee vs Albanian Per Capita Income Correlation Chart
The statistical analysis conducted on geographies consisting of 92,299,068 people shows a weak negative correlation between the proportion of Lumbee and per capita income in the United States with a correlation coefficient (R) of -0.253 and weighted average of $29,845. Similarly, the statistical analysis conducted on geographies consisting of 193,264,500 people shows a poor negative correlation between the proportion of Albanians and per capita income in the United States with a correlation coefficient (R) of -0.161 and weighted average of $47,379, a difference of 58.8%.
Per Capita Income Correlation Summary
| Measurement | Lumbee | Albanian |
| Minimum | $5,266 | $25,698 |
| Maximum | $47,547 | $102,102 |
| Range | $42,281 | $76,404 |
| Mean | $23,880 | $49,796 |
| Median | $23,634 | $47,330 |
| Interquartile 25% (IQ1) | $18,484 | $41,568 |
| Interquartile 75% (IQ3) | $28,340 | $52,221 |
| Interquartile Range (IQR) | $9,856 | $10,654 |
| Standard Deviation (Sample) | $7,789 | $14,520 |
| Standard Deviation (Population) | $7,704 | $14,376 |
Similar Demographics by Per Capita Income
Demographics Similar to Lumbee by Per Capita Income
In terms of per capita income, the demographic groups most similar to Lumbee are Tohono O'odham ($30,256, a difference of 1.4%), Yup'ik ($30,518, a difference of 2.3%), Pima ($30,644, a difference of 2.7%), Navajo ($29,031, a difference of 2.8%), and Hopi ($31,177, a difference of 4.5%).
| Demographics | Rating | Rank | Per Capita Income |
| Immigrants | Yemen | 0.0 /100 | #333 | Tragic $33,696 |
| Natives/Alaskans | 0.0 /100 | #334 | Tragic $33,279 |
| Yuman | 0.0 /100 | #335 | Tragic $33,236 |
| Yakama | 0.0 /100 | #336 | Tragic $33,009 |
| Houma | 0.0 /100 | #337 | Tragic $32,996 |
| Arapaho | 0.0 /100 | #338 | Tragic $32,345 |
| Pueblo | 0.0 /100 | #339 | Tragic $32,012 |
| Crow | 0.0 /100 | #340 | Tragic $31,729 |
| Puerto Ricans | 0.0 /100 | #341 | Tragic $31,268 |
| Hopi | 0.0 /100 | #342 | Tragic $31,177 |
| Pima | 0.0 /100 | #343 | Tragic $30,644 |
| Yup'ik | 0.0 /100 | #344 | Tragic $30,518 |
| Tohono O'odham | 0.0 /100 | #345 | Tragic $30,256 |
| Lumbee | 0.0 /100 | #346 | Tragic $29,845 |
| Navajo | 0.0 /100 | #347 | Tragic $29,031 |
Demographics Similar to Albanians by Per Capita Income
In terms of per capita income, the demographic groups most similar to Albanians are Immigrants from Zimbabwe ($47,394, a difference of 0.030%), Immigrants from Egypt ($47,361, a difference of 0.040%), Alsatian ($47,284, a difference of 0.20%), Immigrants from Moldova ($47,489, a difference of 0.23%), and Carpatho Rusyn ($47,248, a difference of 0.28%).
| Demographics | Rating | Rank | Per Capita Income |
| Ukrainians | 99.3 /100 | #87 | Exceptional $48,014 |
| Croatians | 99.0 /100 | #88 | Exceptional $47,742 |
| Northern Europeans | 98.9 /100 | #89 | Exceptional $47,698 |
| Italians | 98.8 /100 | #90 | Exceptional $47,574 |
| Macedonians | 98.8 /100 | #91 | Exceptional $47,573 |
| Immigrants | Moldova | 98.7 /100 | #92 | Exceptional $47,489 |
| Immigrants | Zimbabwe | 98.5 /100 | #93 | Exceptional $47,394 |
| Albanians | 98.5 /100 | #94 | Exceptional $47,379 |
| Immigrants | Egypt | 98.5 /100 | #95 | Exceptional $47,361 |
| Alsatians | 98.3 /100 | #96 | Exceptional $47,284 |
| Carpatho Rusyns | 98.2 /100 | #97 | Exceptional $47,248 |
| Immigrants | Pakistan | 97.9 /100 | #98 | Exceptional $47,084 |
| Laotians | 97.8 /100 | #99 | Exceptional $47,041 |
| Immigrants | Lebanon | 97.5 /100 | #100 | Exceptional $46,938 |
| Immigrants | Uzbekistan | 97.5 /100 | #101 | Exceptional $46,929 |