Lumbee vs Maltese Per Capita Income
COMPARE
Lumbee
Maltese
Per Capita Income
Per Capita Income Comparison
Lumbee
Maltese
$29,845
PER CAPITA INCOME
0.0/ 100
METRIC RATING
346th/ 347
METRIC RANK
$49,640
PER CAPITA INCOME
99.9/ 100
METRIC RATING
63rd/ 347
METRIC RANK
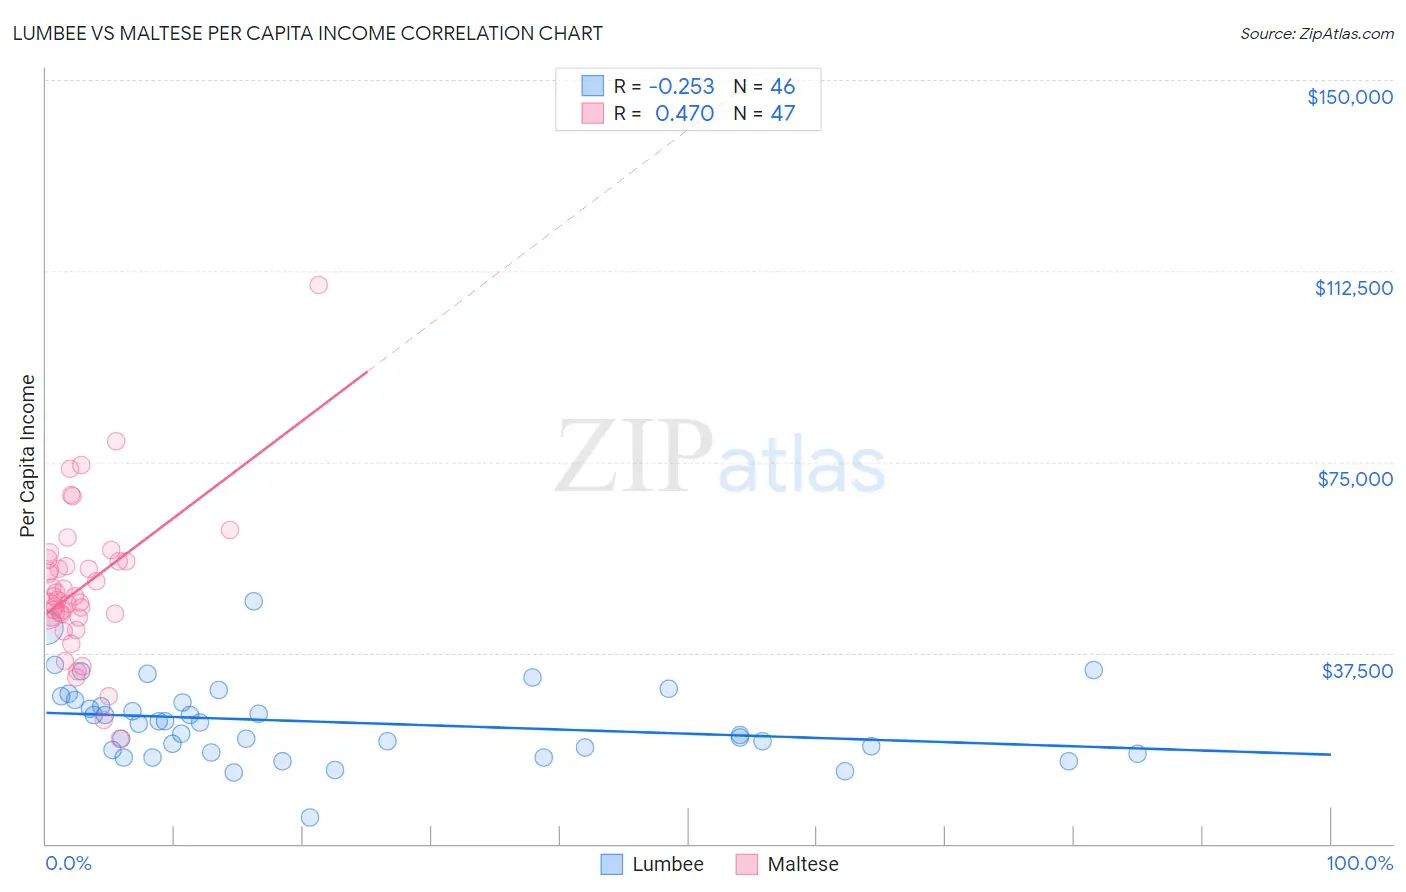
Lumbee vs Maltese Per Capita Income Correlation Chart
The statistical analysis conducted on geographies consisting of 92,299,068 people shows a weak negative correlation between the proportion of Lumbee and per capita income in the United States with a correlation coefficient (R) of -0.253 and weighted average of $29,845. Similarly, the statistical analysis conducted on geographies consisting of 126,316,532 people shows a moderate positive correlation between the proportion of Maltese and per capita income in the United States with a correlation coefficient (R) of 0.470 and weighted average of $49,640, a difference of 66.3%.
Per Capita Income Correlation Summary
| Measurement | Lumbee | Maltese |
| Minimum | $5,266 | $20,612 |
| Maximum | $47,547 | $109,686 |
| Range | $42,281 | $89,074 |
| Mean | $23,880 | $50,567 |
| Median | $23,634 | $48,495 |
| Interquartile 25% (IQ1) | $18,484 | $44,523 |
| Interquartile 75% (IQ3) | $28,340 | $55,569 |
| Interquartile Range (IQR) | $9,856 | $11,046 |
| Standard Deviation (Sample) | $7,789 | $14,877 |
| Standard Deviation (Population) | $7,704 | $14,718 |
Similar Demographics by Per Capita Income
Demographics Similar to Lumbee by Per Capita Income
In terms of per capita income, the demographic groups most similar to Lumbee are Tohono O'odham ($30,256, a difference of 1.4%), Yup'ik ($30,518, a difference of 2.3%), Pima ($30,644, a difference of 2.7%), Navajo ($29,031, a difference of 2.8%), and Hopi ($31,177, a difference of 4.5%).
| Demographics | Rating | Rank | Per Capita Income |
| Immigrants | Yemen | 0.0 /100 | #333 | Tragic $33,696 |
| Natives/Alaskans | 0.0 /100 | #334 | Tragic $33,279 |
| Yuman | 0.0 /100 | #335 | Tragic $33,236 |
| Yakama | 0.0 /100 | #336 | Tragic $33,009 |
| Houma | 0.0 /100 | #337 | Tragic $32,996 |
| Arapaho | 0.0 /100 | #338 | Tragic $32,345 |
| Pueblo | 0.0 /100 | #339 | Tragic $32,012 |
| Crow | 0.0 /100 | #340 | Tragic $31,729 |
| Puerto Ricans | 0.0 /100 | #341 | Tragic $31,268 |
| Hopi | 0.0 /100 | #342 | Tragic $31,177 |
| Pima | 0.0 /100 | #343 | Tragic $30,644 |
| Yup'ik | 0.0 /100 | #344 | Tragic $30,518 |
| Tohono O'odham | 0.0 /100 | #345 | Tragic $30,256 |
| Lumbee | 0.0 /100 | #346 | Tragic $29,845 |
| Navajo | 0.0 /100 | #347 | Tragic $29,031 |
Demographics Similar to Maltese by Per Capita Income
In terms of per capita income, the demographic groups most similar to Maltese are Immigrants from Argentina ($49,627, a difference of 0.030%), Immigrants from Asia ($49,741, a difference of 0.20%), Bolivian ($49,526, a difference of 0.23%), Immigrants from Bulgaria ($49,482, a difference of 0.32%), and Immigrants from Romania ($49,463, a difference of 0.36%).
| Demographics | Rating | Rank | Per Capita Income |
| Asians | 99.9 /100 | #56 | Exceptional $50,057 |
| South Africans | 99.9 /100 | #57 | Exceptional $50,044 |
| Immigrants | Malaysia | 99.9 /100 | #58 | Exceptional $49,983 |
| Bhutanese | 99.9 /100 | #59 | Exceptional $49,894 |
| Immigrants | Scotland | 99.9 /100 | #60 | Exceptional $49,893 |
| Argentineans | 99.9 /100 | #61 | Exceptional $49,862 |
| Immigrants | Asia | 99.9 /100 | #62 | Exceptional $49,741 |
| Maltese | 99.9 /100 | #63 | Exceptional $49,640 |
| Immigrants | Argentina | 99.9 /100 | #64 | Exceptional $49,627 |
| Bolivians | 99.9 /100 | #65 | Exceptional $49,526 |
| Immigrants | Bulgaria | 99.9 /100 | #66 | Exceptional $49,482 |
| Immigrants | Romania | 99.9 /100 | #67 | Exceptional $49,463 |
| Lithuanians | 99.8 /100 | #68 | Exceptional $49,448 |
| Immigrants | Canada | 99.8 /100 | #69 | Exceptional $49,412 |
| Immigrants | Eastern Europe | 99.8 /100 | #70 | Exceptional $49,316 |