Dutch West Indian vs Choctaw Per Capita Income
COMPARE
Dutch West Indian
Choctaw
Per Capita Income
Per Capita Income Comparison
Dutch West Indians
Choctaw
$35,922
PER CAPITA INCOME
0.0/ 100
METRIC RATING
317th/ 347
METRIC RANK
$35,999
PER CAPITA INCOME
0.0/ 100
METRIC RATING
316th/ 347
METRIC RANK
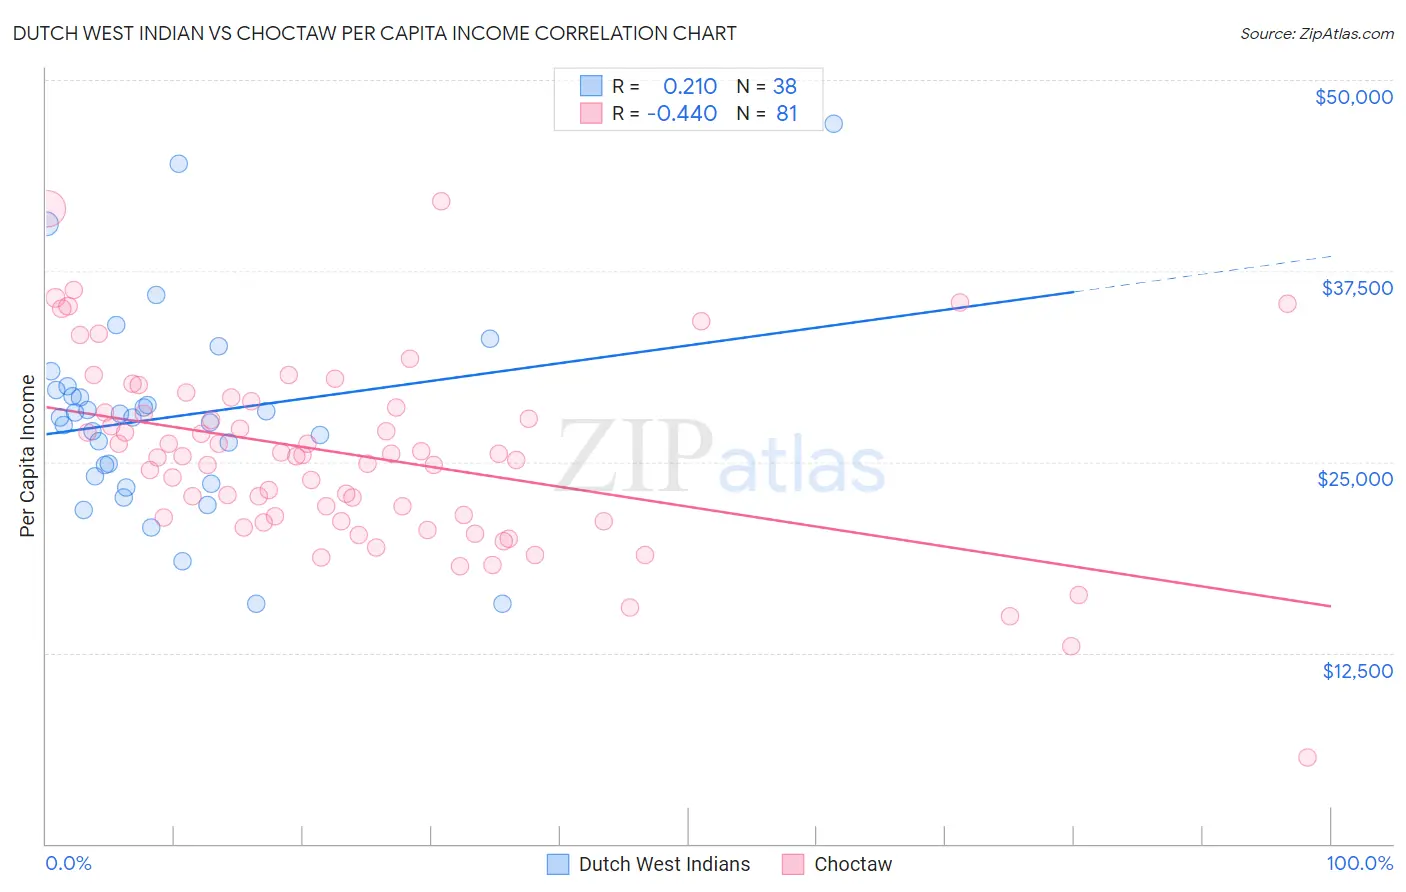
Dutch West Indian vs Choctaw Per Capita Income Correlation Chart
The statistical analysis conducted on geographies consisting of 85,776,103 people shows a weak positive correlation between the proportion of Dutch West Indians and per capita income in the United States with a correlation coefficient (R) of 0.210 and weighted average of $35,922. Similarly, the statistical analysis conducted on geographies consisting of 269,743,960 people shows a moderate negative correlation between the proportion of Choctaw and per capita income in the United States with a correlation coefficient (R) of -0.440 and weighted average of $35,999, a difference of 0.21%.
Per Capita Income Correlation Summary
| Measurement | Dutch West Indian | Choctaw |
| Minimum | $15,696 | $5,606 |
| Maximum | $47,132 | $42,046 |
| Range | $31,436 | $36,440 |
| Mean | $27,952 | $25,429 |
| Median | $27,901 | $25,402 |
| Interquartile 25% (IQ1) | $24,038 | $21,238 |
| Interquartile 75% (IQ3) | $29,729 | $28,737 |
| Interquartile Range (IQR) | $5,691 | $7,499 |
| Standard Deviation (Sample) | $6,566 | $6,184 |
| Standard Deviation (Population) | $6,479 | $6,145 |
Demographics Similar to Dutch West Indians and Choctaw by Per Capita Income
In terms of per capita income, the demographic groups most similar to Dutch West Indians are Bangladeshi ($35,897, a difference of 0.070%), Yaqui ($36,112, a difference of 0.53%), Immigrants from Congo ($35,720, a difference of 0.57%), Hispanic or Latino ($35,688, a difference of 0.66%), and Seminole ($36,180, a difference of 0.72%). Similarly, the demographic groups most similar to Choctaw are Bangladeshi ($35,897, a difference of 0.28%), Yaqui ($36,112, a difference of 0.31%), Seminole ($36,180, a difference of 0.50%), Immigrants from Congo ($35,720, a difference of 0.78%), and Hispanic or Latino ($35,688, a difference of 0.87%).
| Demographics | Rating | Rank | Per Capita Income |
| Immigrants | Haiti | 0.0 /100 | #306 | Tragic $36,849 |
| Immigrants | Latin America | 0.0 /100 | #307 | Tragic $36,823 |
| Fijians | 0.0 /100 | #308 | Tragic $36,690 |
| Immigrants | Honduras | 0.0 /100 | #309 | Tragic $36,665 |
| Ute | 0.0 /100 | #310 | Tragic $36,651 |
| Chippewa | 0.0 /100 | #311 | Tragic $36,631 |
| Chickasaw | 0.0 /100 | #312 | Tragic $36,475 |
| Bahamians | 0.0 /100 | #313 | Tragic $36,427 |
| Seminole | 0.0 /100 | #314 | Tragic $36,180 |
| Yaqui | 0.0 /100 | #315 | Tragic $36,112 |
| Choctaw | 0.0 /100 | #316 | Tragic $35,999 |
| Dutch West Indians | 0.0 /100 | #317 | Tragic $35,922 |
| Bangladeshis | 0.0 /100 | #318 | Tragic $35,897 |
| Immigrants | Congo | 0.0 /100 | #319 | Tragic $35,720 |
| Hispanics or Latinos | 0.0 /100 | #320 | Tragic $35,688 |
| Blacks/African Americans | 0.0 /100 | #321 | Tragic $35,564 |
| Creek | 0.0 /100 | #322 | Tragic $35,546 |
| Cheyenne | 0.0 /100 | #323 | Tragic $35,276 |
| Kiowa | 0.0 /100 | #324 | Tragic $35,102 |
| Immigrants | Central America | 0.0 /100 | #325 | Tragic $34,974 |
| Immigrants | Cuba | 0.0 /100 | #326 | Tragic $34,910 |