Czechoslovakian vs Menominee Median Male Earnings
COMPARE
Czechoslovakian
Menominee
Median Male Earnings
Median Male Earnings Comparison
Czechoslovakians
Menominee
$55,382
MEDIAN MALE EARNINGS
70.5/ 100
METRIC RATING
158th/ 347
METRIC RANK
$42,581
MEDIAN MALE EARNINGS
0.0/ 100
METRIC RATING
337th/ 347
METRIC RANK
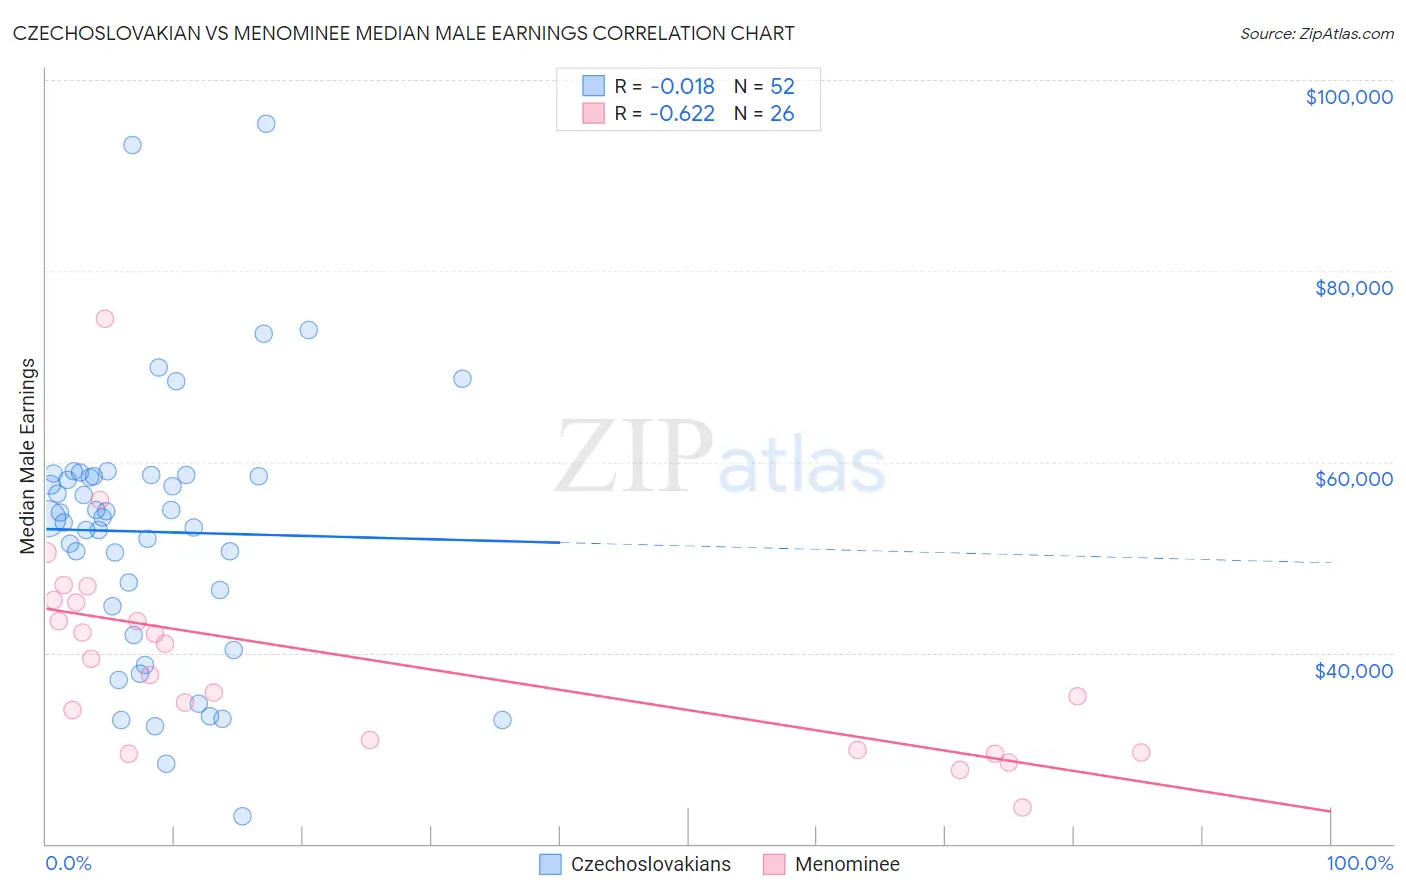
Czechoslovakian vs Menominee Median Male Earnings Correlation Chart
The statistical analysis conducted on geographies consisting of 368,529,148 people shows no correlation between the proportion of Czechoslovakians and median male earnings in the United States with a correlation coefficient (R) of -0.018 and weighted average of $55,382. Similarly, the statistical analysis conducted on geographies consisting of 45,775,457 people shows a significant negative correlation between the proportion of Menominee and median male earnings in the United States with a correlation coefficient (R) of -0.622 and weighted average of $42,581, a difference of 30.1%.
Median Male Earnings Correlation Summary
| Measurement | Czechoslovakian | Menominee |
| Minimum | $22,917 | $23,828 |
| Maximum | $95,417 | $75,000 |
| Range | $72,500 | $51,172 |
| Mean | $52,664 | $39,395 |
| Median | $54,109 | $38,495 |
| Interquartile 25% (IQ1) | $43,411 | $29,844 |
| Interquartile 75% (IQ3) | $58,532 | $45,222 |
| Interquartile Range (IQR) | $15,121 | $15,378 |
| Standard Deviation (Sample) | $14,290 | $10,853 |
| Standard Deviation (Population) | $14,152 | $10,643 |
Similar Demographics by Median Male Earnings
Demographics Similar to Czechoslovakians by Median Male Earnings
In terms of median male earnings, the demographic groups most similar to Czechoslovakians are Alsatian ($55,380, a difference of 0.0%), Basque ($55,370, a difference of 0.020%), Belgian ($55,361, a difference of 0.040%), Icelander ($55,415, a difference of 0.060%), and French ($55,350, a difference of 0.060%).
| Demographics | Rating | Rank | Median Male Earnings |
| Immigrants | Oceania | 76.8 /100 | #151 | Good $55,712 |
| Peruvians | 75.8 /100 | #152 | Good $55,659 |
| Immigrants | Nepal | 75.0 /100 | #153 | Good $55,615 |
| Taiwanese | 73.9 /100 | #154 | Good $55,556 |
| Scandinavians | 73.4 /100 | #155 | Good $55,527 |
| Immigrants | Ethiopia | 71.6 /100 | #156 | Good $55,434 |
| Icelanders | 71.2 /100 | #157 | Good $55,415 |
| Czechoslovakians | 70.5 /100 | #158 | Good $55,382 |
| Alsatians | 70.5 /100 | #159 | Good $55,380 |
| Basques | 70.3 /100 | #160 | Good $55,370 |
| Belgians | 70.1 /100 | #161 | Good $55,361 |
| French | 69.9 /100 | #162 | Good $55,350 |
| Ugandans | 68.6 /100 | #163 | Good $55,290 |
| Immigrants | South Eastern Asia | 67.6 /100 | #164 | Good $55,241 |
| Immigrants | Portugal | 66.3 /100 | #165 | Good $55,182 |
Demographics Similar to Menominee by Median Male Earnings
In terms of median male earnings, the demographic groups most similar to Menominee are Crow ($42,434, a difference of 0.35%), Pima ($42,357, a difference of 0.53%), Navajo ($42,098, a difference of 1.1%), Hopi ($42,060, a difference of 1.2%), and Arapaho ($41,758, a difference of 2.0%).
| Demographics | Rating | Rank | Median Male Earnings |
| Immigrants | Mexico | 0.0 /100 | #330 | Tragic $44,960 |
| Natives/Alaskans | 0.0 /100 | #331 | Tragic $44,775 |
| Bahamians | 0.0 /100 | #332 | Tragic $44,756 |
| Immigrants | Congo | 0.0 /100 | #333 | Tragic $44,204 |
| Immigrants | Yemen | 0.0 /100 | #334 | Tragic $44,083 |
| Spanish American Indians | 0.0 /100 | #335 | Tragic $44,010 |
| Immigrants | Cuba | 0.0 /100 | #336 | Tragic $43,461 |
| Menominee | 0.0 /100 | #337 | Tragic $42,581 |
| Crow | 0.0 /100 | #338 | Tragic $42,434 |
| Pima | 0.0 /100 | #339 | Tragic $42,357 |
| Navajo | 0.0 /100 | #340 | Tragic $42,098 |
| Hopi | 0.0 /100 | #341 | Tragic $42,060 |
| Arapaho | 0.0 /100 | #342 | Tragic $41,758 |
| Lumbee | 0.0 /100 | #343 | Tragic $41,715 |
| Pueblo | 0.0 /100 | #344 | Tragic $41,314 |