Malaysian vs Iraqi Per Capita Income
COMPARE
Malaysian
Iraqi
Per Capita Income
Per Capita Income Comparison
Malaysians
Iraqis
$39,194
PER CAPITA INCOME
0.7/ 100
METRIC RATING
259th/ 347
METRIC RANK
$42,760
PER CAPITA INCOME
26.7/ 100
METRIC RATING
192nd/ 347
METRIC RANK
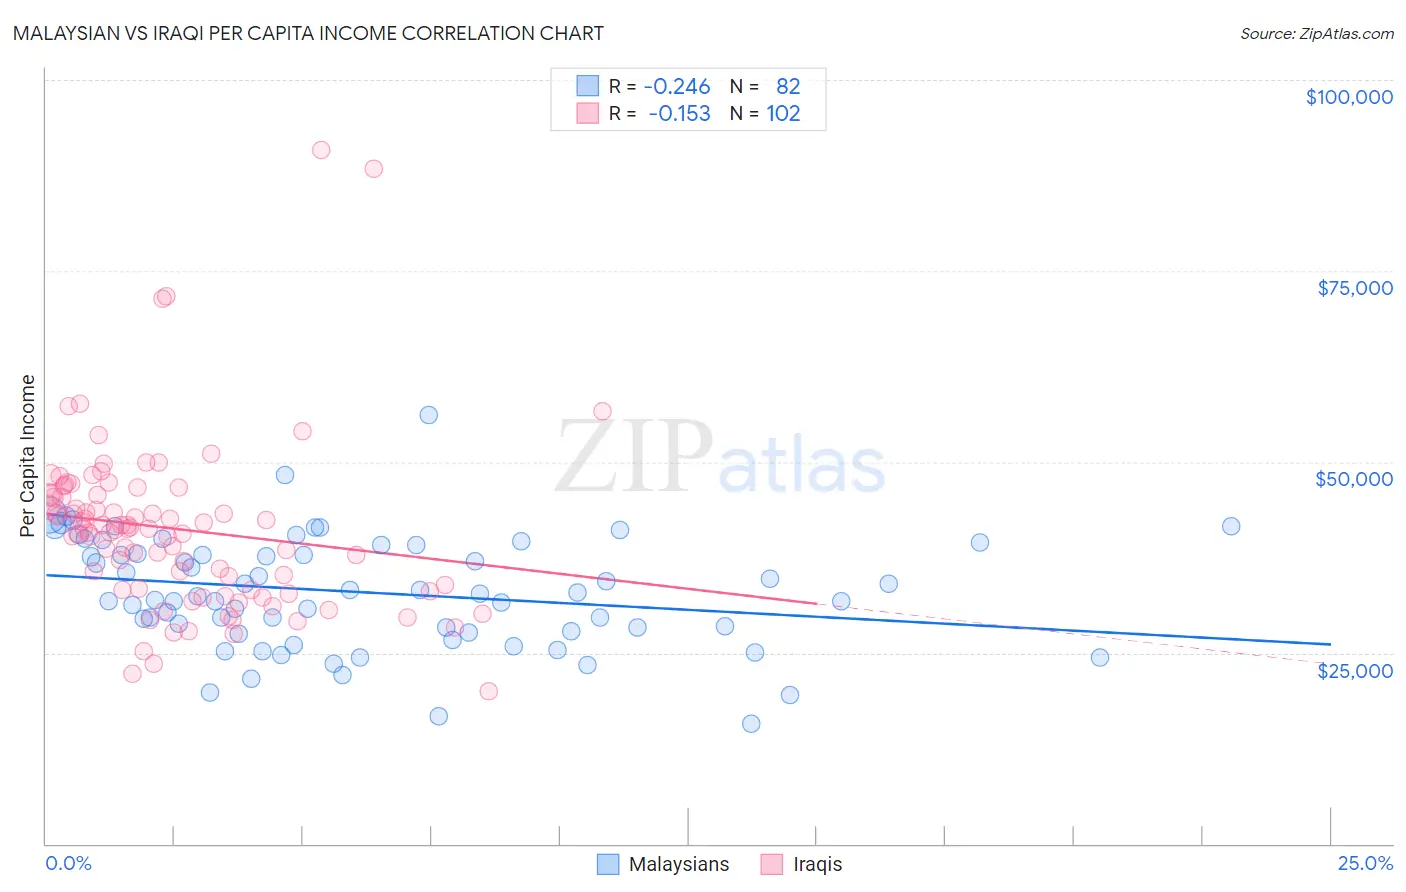
Malaysian vs Iraqi Per Capita Income Correlation Chart
The statistical analysis conducted on geographies consisting of 226,115,655 people shows a weak negative correlation between the proportion of Malaysians and per capita income in the United States with a correlation coefficient (R) of -0.246 and weighted average of $39,194. Similarly, the statistical analysis conducted on geographies consisting of 170,626,957 people shows a poor negative correlation between the proportion of Iraqis and per capita income in the United States with a correlation coefficient (R) of -0.153 and weighted average of $42,760, a difference of 9.1%.
Per Capita Income Correlation Summary
| Measurement | Malaysian | Iraqi |
| Minimum | $15,753 | $19,973 |
| Maximum | $56,163 | $90,903 |
| Range | $40,410 | $70,930 |
| Mean | $32,947 | $41,246 |
| Median | $32,625 | $41,205 |
| Interquartile 25% (IQ1) | $27,821 | $33,285 |
| Interquartile 75% (IQ3) | $39,160 | $45,684 |
| Interquartile Range (IQR) | $11,339 | $12,399 |
| Standard Deviation (Sample) | $7,360 | $11,272 |
| Standard Deviation (Population) | $7,315 | $11,217 |
Similar Demographics by Per Capita Income
Demographics Similar to Malaysians by Per Capita Income
In terms of per capita income, the demographic groups most similar to Malaysians are Alaskan Athabascan ($39,163, a difference of 0.080%), Jamaican ($39,231, a difference of 0.090%), Marshallese ($39,108, a difference of 0.22%), Iroquois ($39,104, a difference of 0.23%), and Belizean ($39,097, a difference of 0.25%).
| Demographics | Rating | Rank | Per Capita Income |
| Immigrants | Azores | 1.0 /100 | #252 | Tragic $39,608 |
| Osage | 1.0 /100 | #253 | Tragic $39,568 |
| Alaska Natives | 1.0 /100 | #254 | Tragic $39,558 |
| Immigrants | Middle Africa | 1.0 /100 | #255 | Tragic $39,529 |
| Hawaiians | 0.8 /100 | #256 | Tragic $39,403 |
| Nicaraguans | 0.8 /100 | #257 | Tragic $39,372 |
| Jamaicans | 0.7 /100 | #258 | Tragic $39,231 |
| Malaysians | 0.7 /100 | #259 | Tragic $39,194 |
| Alaskan Athabascans | 0.6 /100 | #260 | Tragic $39,163 |
| Marshallese | 0.6 /100 | #261 | Tragic $39,108 |
| Iroquois | 0.6 /100 | #262 | Tragic $39,104 |
| Belizeans | 0.6 /100 | #263 | Tragic $39,097 |
| Americans | 0.6 /100 | #264 | Tragic $39,039 |
| Spanish Americans | 0.5 /100 | #265 | Tragic $39,012 |
| Salvadorans | 0.5 /100 | #266 | Tragic $38,858 |
Demographics Similar to Iraqis by Per Capita Income
In terms of per capita income, the demographic groups most similar to Iraqis are Immigrants from Sierra Leone ($42,752, a difference of 0.020%), Yugoslavian ($42,792, a difference of 0.070%), Kenyan ($42,808, a difference of 0.11%), Immigrants from Fiji ($42,694, a difference of 0.16%), and Immigrants from Kenya ($42,661, a difference of 0.23%).
| Demographics | Rating | Rank | Per Capita Income |
| Immigrants | Immigrants | 32.5 /100 | #185 | Fair $43,010 |
| French Canadians | 32.3 /100 | #186 | Fair $43,003 |
| Immigrants | Colombia | 31.5 /100 | #187 | Fair $42,971 |
| Immigrants | Africa | 31.0 /100 | #188 | Fair $42,950 |
| Bermudans | 30.1 /100 | #189 | Fair $42,911 |
| Kenyans | 27.7 /100 | #190 | Fair $42,808 |
| Yugoslavians | 27.4 /100 | #191 | Fair $42,792 |
| Iraqis | 26.7 /100 | #192 | Fair $42,760 |
| Immigrants | Sierra Leone | 26.5 /100 | #193 | Fair $42,752 |
| Immigrants | Fiji | 25.2 /100 | #194 | Fair $42,694 |
| Immigrants | Kenya | 24.5 /100 | #195 | Fair $42,661 |
| Dutch | 23.4 /100 | #196 | Fair $42,605 |
| Scotch-Irish | 22.6 /100 | #197 | Fair $42,563 |
| Immigrants | Portugal | 19.7 /100 | #198 | Poor $42,412 |
| Barbadians | 19.6 /100 | #199 | Poor $42,406 |