Spaniard vs Iraqi Per Capita Income
COMPARE
Spaniard
Iraqi
Per Capita Income
Per Capita Income Comparison
Spaniards
Iraqis
$43,028
PER CAPITA INCOME
32.9/ 100
METRIC RATING
184th/ 347
METRIC RANK
$42,760
PER CAPITA INCOME
26.7/ 100
METRIC RATING
192nd/ 347
METRIC RANK
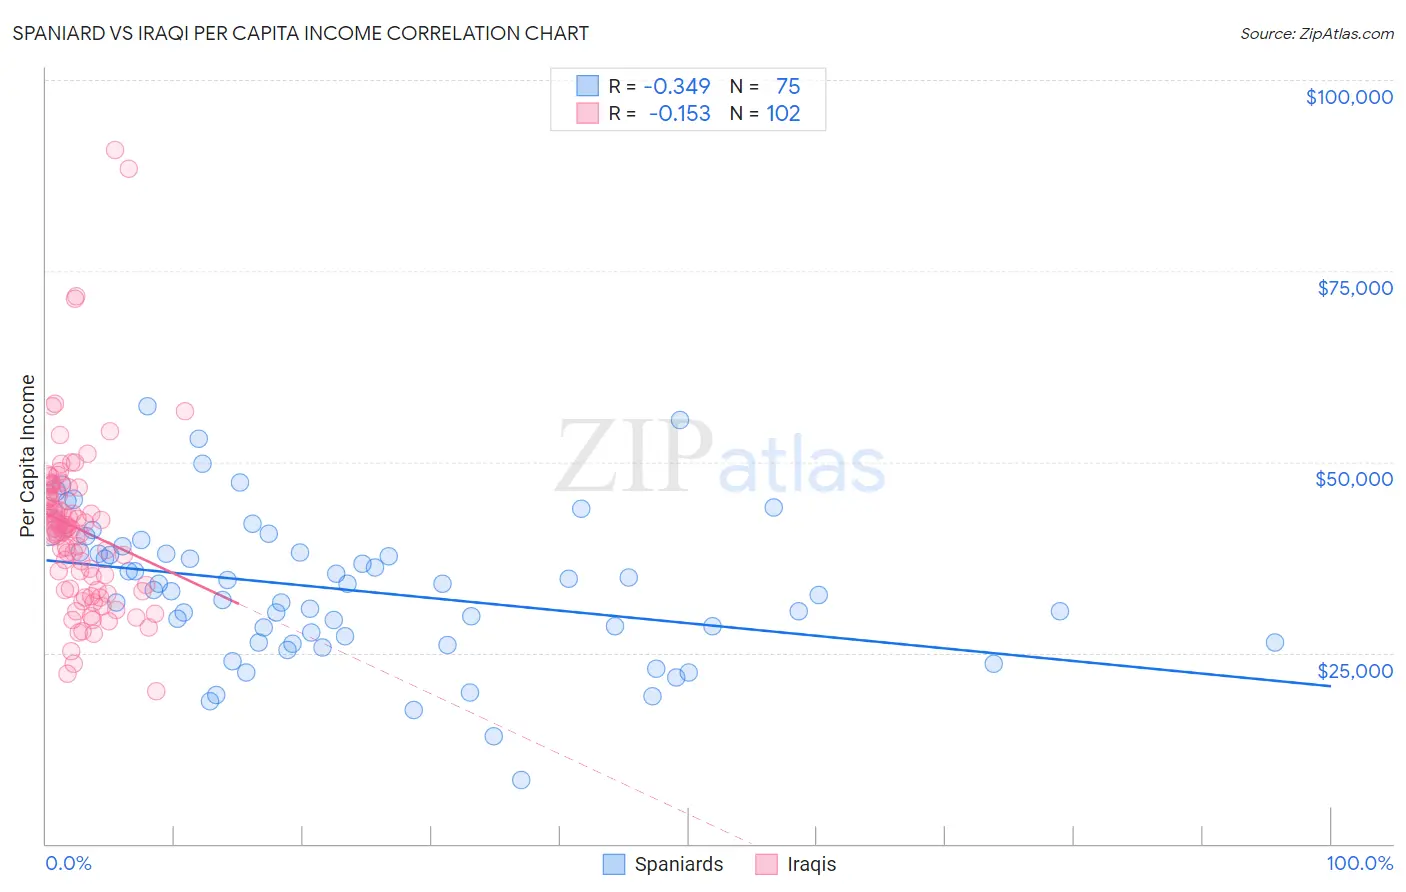
Spaniard vs Iraqi Per Capita Income Correlation Chart
The statistical analysis conducted on geographies consisting of 443,584,156 people shows a mild negative correlation between the proportion of Spaniards and per capita income in the United States with a correlation coefficient (R) of -0.349 and weighted average of $43,028. Similarly, the statistical analysis conducted on geographies consisting of 170,626,957 people shows a poor negative correlation between the proportion of Iraqis and per capita income in the United States with a correlation coefficient (R) of -0.153 and weighted average of $42,760, a difference of 0.63%.
Per Capita Income Correlation Summary
| Measurement | Spaniard | Iraqi |
| Minimum | $8,290 | $19,973 |
| Maximum | $57,272 | $90,903 |
| Range | $48,982 | $70,930 |
| Mean | $33,214 | $41,246 |
| Median | $33,192 | $41,205 |
| Interquartile 25% (IQ1) | $26,374 | $33,285 |
| Interquartile 75% (IQ3) | $38,222 | $45,684 |
| Interquartile Range (IQR) | $11,848 | $12,399 |
| Standard Deviation (Sample) | $9,446 | $11,272 |
| Standard Deviation (Population) | $9,383 | $11,217 |
Demographics Similar to Spaniards and Iraqis by Per Capita Income
In terms of per capita income, the demographic groups most similar to Spaniards are Immigrants ($43,010, a difference of 0.040%), French Canadian ($43,003, a difference of 0.060%), German ($43,067, a difference of 0.090%), Immigrants from Colombia ($42,971, a difference of 0.13%), and Immigrants from Africa ($42,950, a difference of 0.18%). Similarly, the demographic groups most similar to Iraqis are Immigrants from Sierra Leone ($42,752, a difference of 0.020%), Yugoslavian ($42,792, a difference of 0.070%), Kenyan ($42,808, a difference of 0.11%), Immigrants from Fiji ($42,694, a difference of 0.16%), and Immigrants from Kenya ($42,661, a difference of 0.23%).
| Demographics | Rating | Rank | Per Capita Income |
| Immigrants | Costa Rica | 44.5 /100 | #178 | Average $43,464 |
| Finns | 44.4 /100 | #179 | Average $43,461 |
| Sierra Leoneans | 42.9 /100 | #180 | Average $43,405 |
| Welsh | 38.2 /100 | #181 | Fair $43,233 |
| Immigrants | Vietnam | 38.1 /100 | #182 | Fair $43,229 |
| Germans | 33.9 /100 | #183 | Fair $43,067 |
| Spaniards | 32.9 /100 | #184 | Fair $43,028 |
| Immigrants | Immigrants | 32.5 /100 | #185 | Fair $43,010 |
| French Canadians | 32.3 /100 | #186 | Fair $43,003 |
| Immigrants | Colombia | 31.5 /100 | #187 | Fair $42,971 |
| Immigrants | Africa | 31.0 /100 | #188 | Fair $42,950 |
| Bermudans | 30.1 /100 | #189 | Fair $42,911 |
| Kenyans | 27.7 /100 | #190 | Fair $42,808 |
| Yugoslavians | 27.4 /100 | #191 | Fair $42,792 |
| Iraqis | 26.7 /100 | #192 | Fair $42,760 |
| Immigrants | Sierra Leone | 26.5 /100 | #193 | Fair $42,752 |
| Immigrants | Fiji | 25.2 /100 | #194 | Fair $42,694 |
| Immigrants | Kenya | 24.5 /100 | #195 | Fair $42,661 |
| Dutch | 23.4 /100 | #196 | Fair $42,605 |
| Scotch-Irish | 22.6 /100 | #197 | Fair $42,563 |
| Immigrants | Portugal | 19.7 /100 | #198 | Poor $42,412 |