Korean vs Immigrants from Lebanon Median Male Earnings
COMPARE
Korean
Immigrants from Lebanon
Median Male Earnings
Median Male Earnings Comparison
Koreans
Immigrants from Lebanon
$56,672
MEDIAN MALE EARNINGS
89.4/ 100
METRIC RATING
130th/ 347
METRIC RANK
$58,835
MEDIAN MALE EARNINGS
98.6/ 100
METRIC RATING
95th/ 347
METRIC RANK
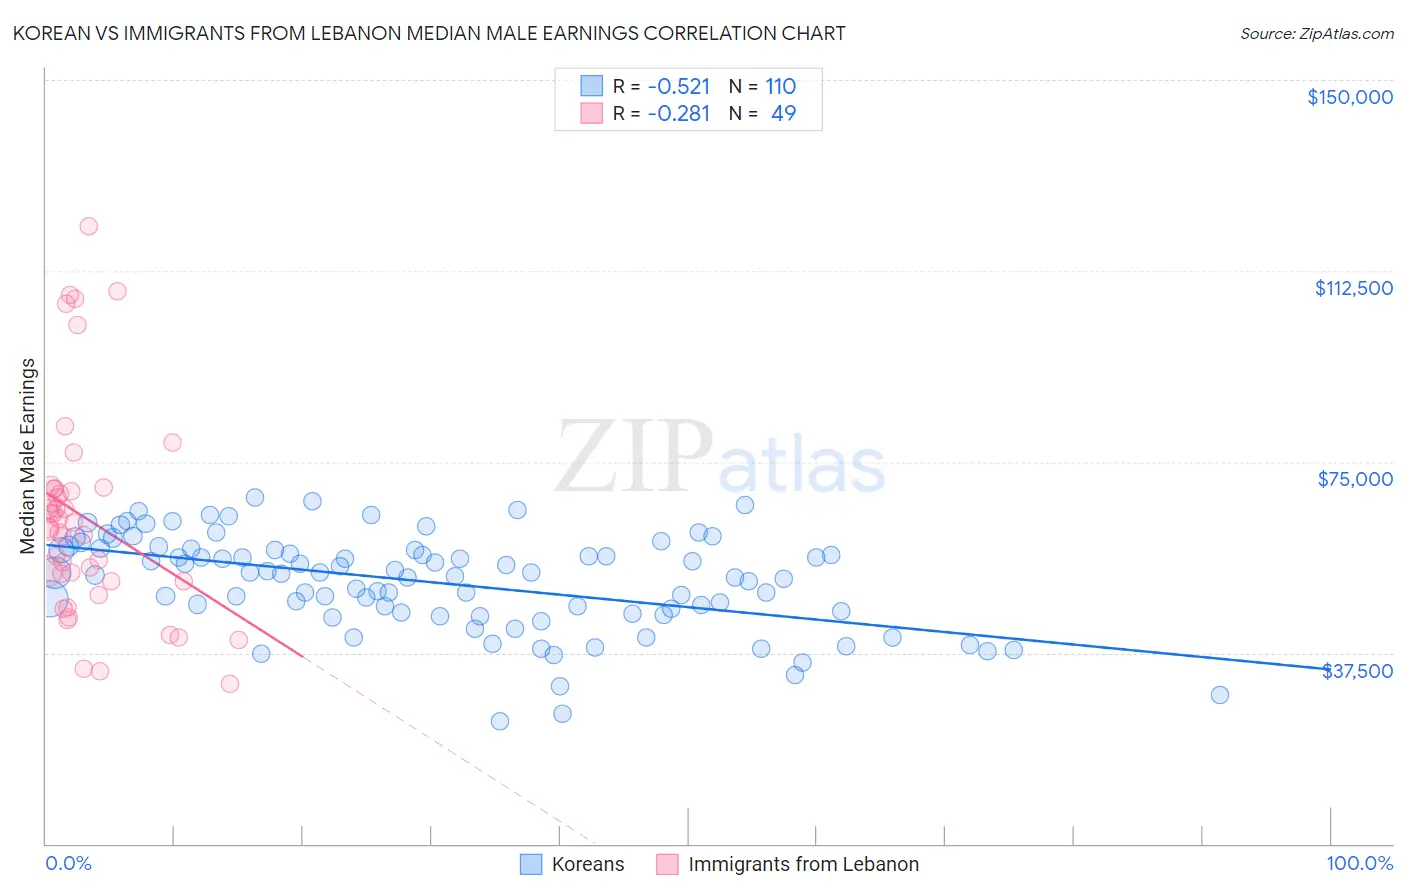
Korean vs Immigrants from Lebanon Median Male Earnings Correlation Chart
The statistical analysis conducted on geographies consisting of 510,664,628 people shows a substantial negative correlation between the proportion of Koreans and median male earnings in the United States with a correlation coefficient (R) of -0.521 and weighted average of $56,672. Similarly, the statistical analysis conducted on geographies consisting of 217,125,593 people shows a weak negative correlation between the proportion of Immigrants from Lebanon and median male earnings in the United States with a correlation coefficient (R) of -0.281 and weighted average of $58,835, a difference of 3.8%.
Median Male Earnings Correlation Summary
| Measurement | Korean | Immigrants from Lebanon |
| Minimum | $24,028 | $31,325 |
| Maximum | $67,994 | $121,345 |
| Range | $43,966 | $90,020 |
| Mean | $51,299 | $64,055 |
| Median | $53,093 | $61,932 |
| Interquartile 25% (IQ1) | $45,357 | $51,586 |
| Interquartile 75% (IQ3) | $57,742 | $69,695 |
| Interquartile Range (IQR) | $12,385 | $18,109 |
| Standard Deviation (Sample) | $9,399 | $20,593 |
| Standard Deviation (Population) | $9,356 | $20,382 |
Similar Demographics by Median Male Earnings
Demographics Similar to Koreans by Median Male Earnings
In terms of median male earnings, the demographic groups most similar to Koreans are Portuguese ($56,663, a difference of 0.020%), Pakistani ($56,719, a difference of 0.080%), Czech ($56,546, a difference of 0.22%), Immigrants from Germany ($56,542, a difference of 0.23%), and Immigrants from Syria ($56,830, a difference of 0.28%).
| Demographics | Rating | Rank | Median Male Earnings |
| Slovenes | 93.1 /100 | #123 | Exceptional $57,145 |
| Chileans | 91.9 /100 | #124 | Exceptional $56,973 |
| Immigrants | Morocco | 91.8 /100 | #125 | Exceptional $56,958 |
| Chinese | 91.1 /100 | #126 | Exceptional $56,872 |
| Brazilians | 90.9 /100 | #127 | Exceptional $56,837 |
| Immigrants | Syria | 90.8 /100 | #128 | Exceptional $56,830 |
| Pakistanis | 89.9 /100 | #129 | Excellent $56,719 |
| Koreans | 89.4 /100 | #130 | Excellent $56,672 |
| Portuguese | 89.4 /100 | #131 | Excellent $56,663 |
| Czechs | 88.2 /100 | #132 | Excellent $56,546 |
| Immigrants | Germany | 88.2 /100 | #133 | Excellent $56,542 |
| Moroccans | 87.7 /100 | #134 | Excellent $56,499 |
| Irish | 87.4 /100 | #135 | Excellent $56,464 |
| Immigrants | Saudi Arabia | 87.2 /100 | #136 | Excellent $56,452 |
| Slavs | 86.5 /100 | #137 | Excellent $56,390 |
Demographics Similar to Immigrants from Lebanon by Median Male Earnings
In terms of median male earnings, the demographic groups most similar to Immigrants from Lebanon are Albanian ($58,680, a difference of 0.27%), Northern European ($58,588, a difference of 0.42%), Jordanian ($58,500, a difference of 0.57%), Immigrants from North Macedonia ($59,189, a difference of 0.60%), and Immigrants from Southern Europe ($59,217, a difference of 0.65%).
| Demographics | Rating | Rank | Median Male Earnings |
| Immigrants | Argentina | 99.3 /100 | #88 | Exceptional $59,491 |
| Immigrants | Moldova | 99.2 /100 | #89 | Exceptional $59,417 |
| Austrians | 99.2 /100 | #90 | Exceptional $59,359 |
| Laotians | 99.2 /100 | #91 | Exceptional $59,351 |
| Immigrants | Kazakhstan | 99.1 /100 | #92 | Exceptional $59,278 |
| Immigrants | Southern Europe | 99.0 /100 | #93 | Exceptional $59,217 |
| Immigrants | North Macedonia | 99.0 /100 | #94 | Exceptional $59,189 |
| Immigrants | Lebanon | 98.6 /100 | #95 | Exceptional $58,835 |
| Albanians | 98.4 /100 | #96 | Exceptional $58,680 |
| Northern Europeans | 98.2 /100 | #97 | Exceptional $58,588 |
| Jordanians | 98.1 /100 | #98 | Exceptional $58,500 |
| Immigrants | Poland | 98.0 /100 | #99 | Exceptional $58,452 |
| Assyrians/Chaldeans/Syriacs | 97.9 /100 | #100 | Exceptional $58,437 |
| Immigrants | Brazil | 97.7 /100 | #101 | Exceptional $58,324 |
| Syrians | 97.4 /100 | #102 | Exceptional $58,187 |