Korean vs Lumbee Median Male Earnings
COMPARE
Korean
Lumbee
Median Male Earnings
Median Male Earnings Comparison
Koreans
Lumbee
$56,672
MEDIAN MALE EARNINGS
89.4/ 100
METRIC RATING
130th/ 347
METRIC RANK
$41,715
MEDIAN MALE EARNINGS
0.0/ 100
METRIC RATING
343rd/ 347
METRIC RANK
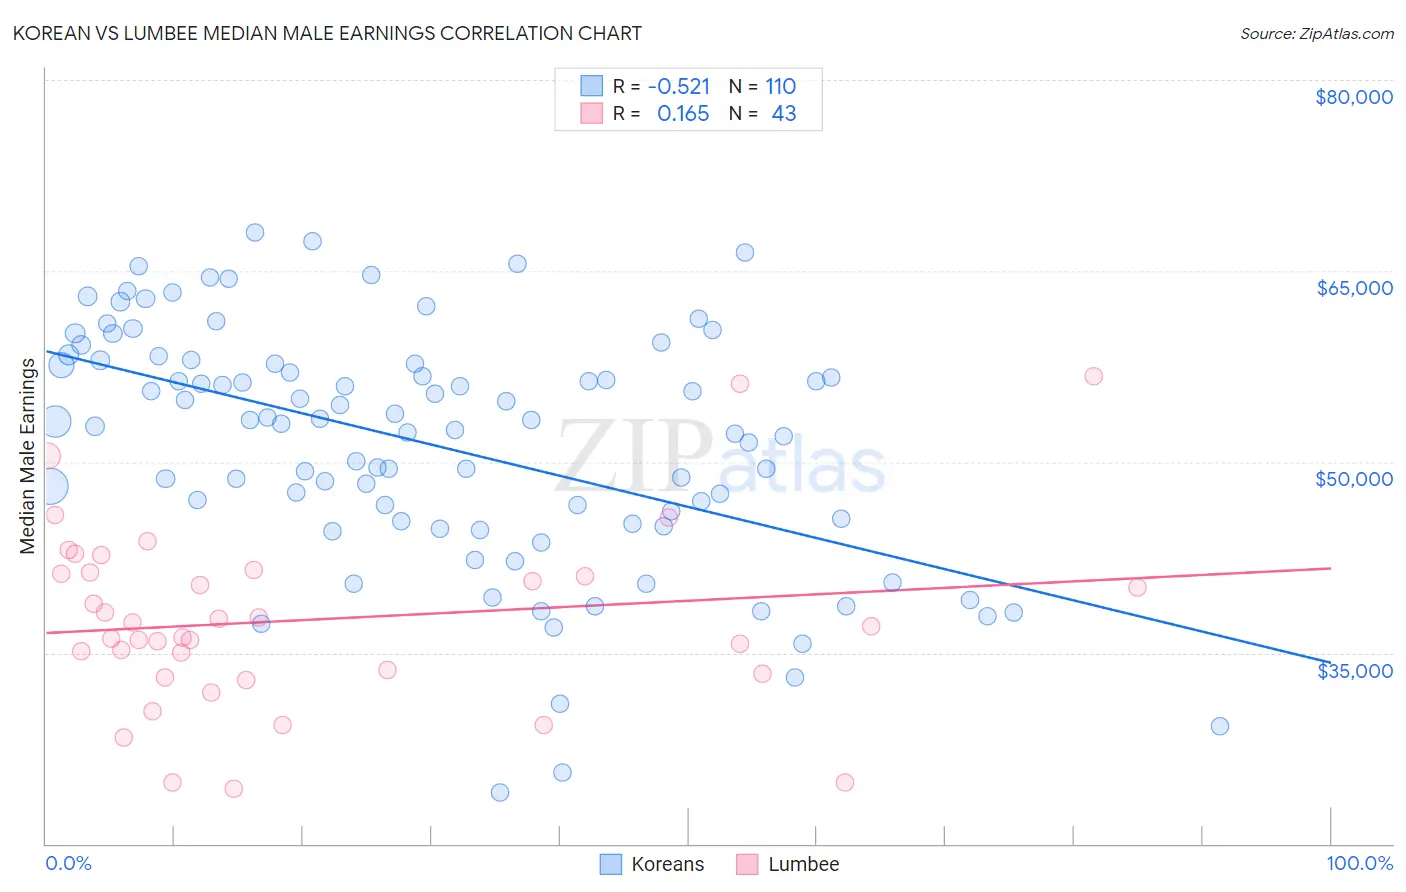
Korean vs Lumbee Median Male Earnings Correlation Chart
The statistical analysis conducted on geographies consisting of 510,664,628 people shows a substantial negative correlation between the proportion of Koreans and median male earnings in the United States with a correlation coefficient (R) of -0.521 and weighted average of $56,672. Similarly, the statistical analysis conducted on geographies consisting of 92,276,202 people shows a poor positive correlation between the proportion of Lumbee and median male earnings in the United States with a correlation coefficient (R) of 0.165 and weighted average of $41,715, a difference of 35.8%.
Median Male Earnings Correlation Summary
| Measurement | Korean | Lumbee |
| Minimum | $24,028 | $24,297 |
| Maximum | $67,994 | $56,719 |
| Range | $43,966 | $32,422 |
| Mean | $51,299 | $37,623 |
| Median | $53,093 | $37,072 |
| Interquartile 25% (IQ1) | $45,357 | $33,323 |
| Interquartile 75% (IQ3) | $57,742 | $41,323 |
| Interquartile Range (IQR) | $12,385 | $8,000 |
| Standard Deviation (Sample) | $9,399 | $7,117 |
| Standard Deviation (Population) | $9,356 | $7,034 |
Similar Demographics by Median Male Earnings
Demographics Similar to Koreans by Median Male Earnings
In terms of median male earnings, the demographic groups most similar to Koreans are Portuguese ($56,663, a difference of 0.020%), Pakistani ($56,719, a difference of 0.080%), Czech ($56,546, a difference of 0.22%), Immigrants from Germany ($56,542, a difference of 0.23%), and Immigrants from Syria ($56,830, a difference of 0.28%).
| Demographics | Rating | Rank | Median Male Earnings |
| Slovenes | 93.1 /100 | #123 | Exceptional $57,145 |
| Chileans | 91.9 /100 | #124 | Exceptional $56,973 |
| Immigrants | Morocco | 91.8 /100 | #125 | Exceptional $56,958 |
| Chinese | 91.1 /100 | #126 | Exceptional $56,872 |
| Brazilians | 90.9 /100 | #127 | Exceptional $56,837 |
| Immigrants | Syria | 90.8 /100 | #128 | Exceptional $56,830 |
| Pakistanis | 89.9 /100 | #129 | Excellent $56,719 |
| Koreans | 89.4 /100 | #130 | Excellent $56,672 |
| Portuguese | 89.4 /100 | #131 | Excellent $56,663 |
| Czechs | 88.2 /100 | #132 | Excellent $56,546 |
| Immigrants | Germany | 88.2 /100 | #133 | Excellent $56,542 |
| Moroccans | 87.7 /100 | #134 | Excellent $56,499 |
| Irish | 87.4 /100 | #135 | Excellent $56,464 |
| Immigrants | Saudi Arabia | 87.2 /100 | #136 | Excellent $56,452 |
| Slavs | 86.5 /100 | #137 | Excellent $56,390 |
Demographics Similar to Lumbee by Median Male Earnings
In terms of median male earnings, the demographic groups most similar to Lumbee are Arapaho ($41,758, a difference of 0.10%), Hopi ($42,060, a difference of 0.83%), Navajo ($42,098, a difference of 0.92%), Pueblo ($41,314, a difference of 0.97%), and Pima ($42,357, a difference of 1.5%).
| Demographics | Rating | Rank | Median Male Earnings |
| Immigrants | Congo | 0.0 /100 | #333 | Tragic $44,204 |
| Immigrants | Yemen | 0.0 /100 | #334 | Tragic $44,083 |
| Spanish American Indians | 0.0 /100 | #335 | Tragic $44,010 |
| Immigrants | Cuba | 0.0 /100 | #336 | Tragic $43,461 |
| Menominee | 0.0 /100 | #337 | Tragic $42,581 |
| Crow | 0.0 /100 | #338 | Tragic $42,434 |
| Pima | 0.0 /100 | #339 | Tragic $42,357 |
| Navajo | 0.0 /100 | #340 | Tragic $42,098 |
| Hopi | 0.0 /100 | #341 | Tragic $42,060 |
| Arapaho | 0.0 /100 | #342 | Tragic $41,758 |
| Lumbee | 0.0 /100 | #343 | Tragic $41,715 |
| Pueblo | 0.0 /100 | #344 | Tragic $41,314 |
| Puerto Ricans | 0.0 /100 | #345 | Tragic $40,071 |
| Tohono O'odham | 0.0 /100 | #346 | Tragic $39,543 |
| Yup'ik | 0.0 /100 | #347 | Tragic $39,504 |