Immigrants from Saudi Arabia vs Immigrants from Lebanon Median Male Earnings
COMPARE
Immigrants from Saudi Arabia
Immigrants from Lebanon
Median Male Earnings
Median Male Earnings Comparison
Immigrants from Saudi Arabia
Immigrants from Lebanon
$56,452
MEDIAN MALE EARNINGS
87.2/ 100
METRIC RATING
136th/ 347
METRIC RANK
$58,835
MEDIAN MALE EARNINGS
98.6/ 100
METRIC RATING
95th/ 347
METRIC RANK
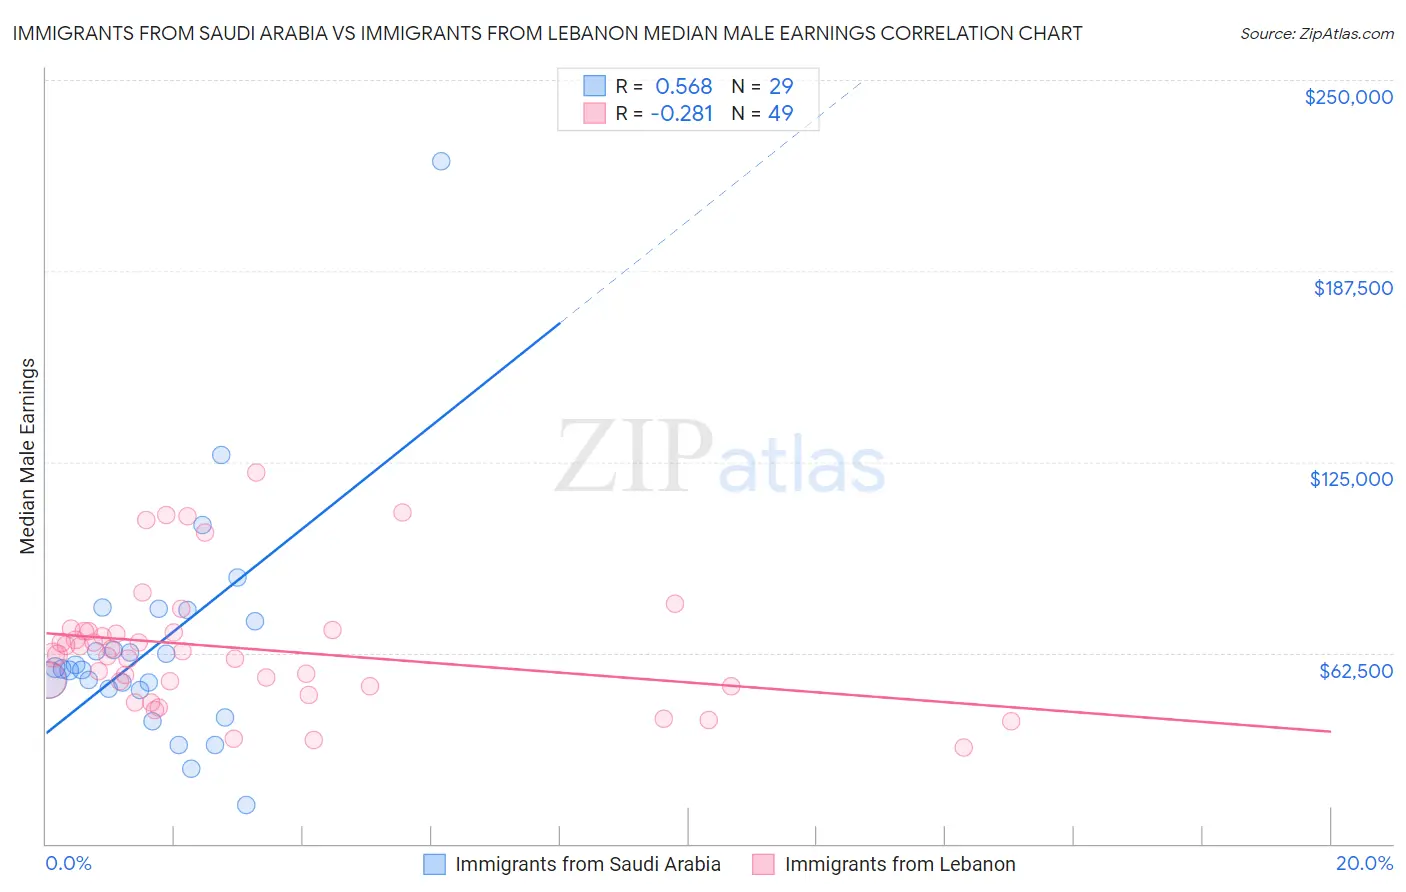
Immigrants from Saudi Arabia vs Immigrants from Lebanon Median Male Earnings Correlation Chart
The statistical analysis conducted on geographies consisting of 164,293,936 people shows a substantial positive correlation between the proportion of Immigrants from Saudi Arabia and median male earnings in the United States with a correlation coefficient (R) of 0.568 and weighted average of $56,452. Similarly, the statistical analysis conducted on geographies consisting of 217,125,593 people shows a weak negative correlation between the proportion of Immigrants from Lebanon and median male earnings in the United States with a correlation coefficient (R) of -0.281 and weighted average of $58,835, a difference of 4.2%.
Median Male Earnings Correlation Summary
| Measurement | Immigrants from Saudi Arabia | Immigrants from Lebanon |
| Minimum | $12,696 | $31,325 |
| Maximum | $223,261 | $121,345 |
| Range | $210,565 | $90,020 |
| Mean | $64,851 | $64,055 |
| Median | $57,085 | $61,932 |
| Interquartile 25% (IQ1) | $50,362 | $51,586 |
| Interquartile 75% (IQ3) | $74,807 | $69,695 |
| Interquartile Range (IQR) | $24,445 | $18,109 |
| Standard Deviation (Sample) | $38,008 | $20,593 |
| Standard Deviation (Population) | $37,347 | $20,382 |
Similar Demographics by Median Male Earnings
Demographics Similar to Immigrants from Saudi Arabia by Median Male Earnings
In terms of median male earnings, the demographic groups most similar to Immigrants from Saudi Arabia are Irish ($56,464, a difference of 0.020%), Moroccan ($56,499, a difference of 0.080%), Slavic ($56,390, a difference of 0.11%), Immigrants from Germany ($56,542, a difference of 0.16%), and Czech ($56,546, a difference of 0.17%).
| Demographics | Rating | Rank | Median Male Earnings |
| Pakistanis | 89.9 /100 | #129 | Excellent $56,719 |
| Koreans | 89.4 /100 | #130 | Excellent $56,672 |
| Portuguese | 89.4 /100 | #131 | Excellent $56,663 |
| Czechs | 88.2 /100 | #132 | Excellent $56,546 |
| Immigrants | Germany | 88.2 /100 | #133 | Excellent $56,542 |
| Moroccans | 87.7 /100 | #134 | Excellent $56,499 |
| Irish | 87.4 /100 | #135 | Excellent $56,464 |
| Immigrants | Saudi Arabia | 87.2 /100 | #136 | Excellent $56,452 |
| Slavs | 86.5 /100 | #137 | Excellent $56,390 |
| Slovaks | 85.5 /100 | #138 | Excellent $56,306 |
| Zimbabweans | 85.5 /100 | #139 | Excellent $56,302 |
| Luxembourgers | 85.5 /100 | #140 | Excellent $56,300 |
| Danes | 84.8 /100 | #141 | Excellent $56,246 |
| Ethiopians | 84.8 /100 | #142 | Excellent $56,243 |
| Sri Lankans | 83.4 /100 | #143 | Excellent $56,136 |
Demographics Similar to Immigrants from Lebanon by Median Male Earnings
In terms of median male earnings, the demographic groups most similar to Immigrants from Lebanon are Albanian ($58,680, a difference of 0.27%), Northern European ($58,588, a difference of 0.42%), Jordanian ($58,500, a difference of 0.57%), Immigrants from North Macedonia ($59,189, a difference of 0.60%), and Immigrants from Southern Europe ($59,217, a difference of 0.65%).
| Demographics | Rating | Rank | Median Male Earnings |
| Immigrants | Argentina | 99.3 /100 | #88 | Exceptional $59,491 |
| Immigrants | Moldova | 99.2 /100 | #89 | Exceptional $59,417 |
| Austrians | 99.2 /100 | #90 | Exceptional $59,359 |
| Laotians | 99.2 /100 | #91 | Exceptional $59,351 |
| Immigrants | Kazakhstan | 99.1 /100 | #92 | Exceptional $59,278 |
| Immigrants | Southern Europe | 99.0 /100 | #93 | Exceptional $59,217 |
| Immigrants | North Macedonia | 99.0 /100 | #94 | Exceptional $59,189 |
| Immigrants | Lebanon | 98.6 /100 | #95 | Exceptional $58,835 |
| Albanians | 98.4 /100 | #96 | Exceptional $58,680 |
| Northern Europeans | 98.2 /100 | #97 | Exceptional $58,588 |
| Jordanians | 98.1 /100 | #98 | Exceptional $58,500 |
| Immigrants | Poland | 98.0 /100 | #99 | Exceptional $58,452 |
| Assyrians/Chaldeans/Syriacs | 97.9 /100 | #100 | Exceptional $58,437 |
| Immigrants | Brazil | 97.7 /100 | #101 | Exceptional $58,324 |
| Syrians | 97.4 /100 | #102 | Exceptional $58,187 |