Cuban vs Immigrants from Lebanon Median Male Earnings
COMPARE
Cuban
Immigrants from Lebanon
Median Male Earnings
Median Male Earnings Comparison
Cubans
Immigrants from Lebanon
$46,580
MEDIAN MALE EARNINGS
0.0/ 100
METRIC RATING
310th/ 347
METRIC RANK
$58,835
MEDIAN MALE EARNINGS
98.6/ 100
METRIC RATING
95th/ 347
METRIC RANK
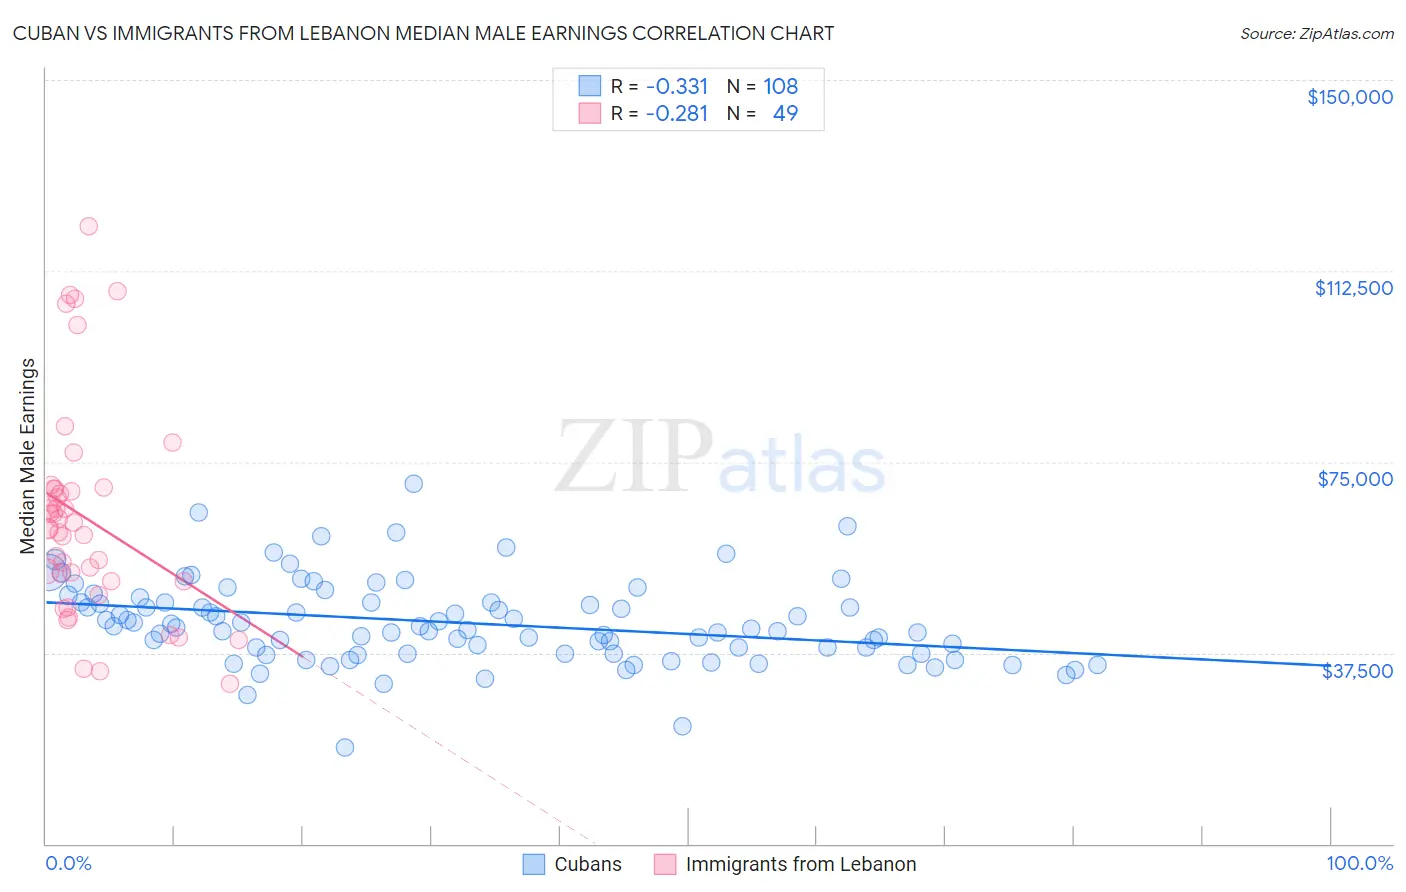
Cuban vs Immigrants from Lebanon Median Male Earnings Correlation Chart
The statistical analysis conducted on geographies consisting of 449,183,844 people shows a mild negative correlation between the proportion of Cubans and median male earnings in the United States with a correlation coefficient (R) of -0.331 and weighted average of $46,580. Similarly, the statistical analysis conducted on geographies consisting of 217,125,593 people shows a weak negative correlation between the proportion of Immigrants from Lebanon and median male earnings in the United States with a correlation coefficient (R) of -0.281 and weighted average of $58,835, a difference of 26.3%.
Median Male Earnings Correlation Summary
| Measurement | Cuban | Immigrants from Lebanon |
| Minimum | $18,938 | $31,325 |
| Maximum | $70,693 | $121,345 |
| Range | $51,755 | $90,020 |
| Mean | $43,444 | $64,055 |
| Median | $42,447 | $61,932 |
| Interquartile 25% (IQ1) | $37,372 | $51,586 |
| Interquartile 75% (IQ3) | $47,400 | $69,695 |
| Interquartile Range (IQR) | $10,028 | $18,109 |
| Standard Deviation (Sample) | $8,309 | $20,593 |
| Standard Deviation (Population) | $8,270 | $20,382 |
Similar Demographics by Median Male Earnings
Demographics Similar to Cubans by Median Male Earnings
In terms of median male earnings, the demographic groups most similar to Cubans are Creek ($46,594, a difference of 0.030%), Ottawa ($46,611, a difference of 0.070%), Dutch West Indian ($46,656, a difference of 0.16%), Immigrants from Dominican Republic ($46,655, a difference of 0.16%), and Apache ($46,429, a difference of 0.33%).
| Demographics | Rating | Rank | Median Male Earnings |
| Yaqui | 0.1 /100 | #303 | Tragic $46,777 |
| Bangladeshis | 0.1 /100 | #304 | Tragic $46,744 |
| Guatemalans | 0.0 /100 | #305 | Tragic $46,736 |
| Dutch West Indians | 0.0 /100 | #306 | Tragic $46,656 |
| Immigrants | Dominican Republic | 0.0 /100 | #307 | Tragic $46,655 |
| Ottawa | 0.0 /100 | #308 | Tragic $46,611 |
| Creek | 0.0 /100 | #309 | Tragic $46,594 |
| Cubans | 0.0 /100 | #310 | Tragic $46,580 |
| Apache | 0.0 /100 | #311 | Tragic $46,429 |
| Hispanics or Latinos | 0.0 /100 | #312 | Tragic $46,419 |
| Hondurans | 0.0 /100 | #313 | Tragic $46,374 |
| Chippewa | 0.0 /100 | #314 | Tragic $46,368 |
| Immigrants | Guatemala | 0.0 /100 | #315 | Tragic $46,244 |
| Immigrants | Caribbean | 0.0 /100 | #316 | Tragic $46,193 |
| Mexicans | 0.0 /100 | #317 | Tragic $46,147 |
Demographics Similar to Immigrants from Lebanon by Median Male Earnings
In terms of median male earnings, the demographic groups most similar to Immigrants from Lebanon are Albanian ($58,680, a difference of 0.27%), Northern European ($58,588, a difference of 0.42%), Jordanian ($58,500, a difference of 0.57%), Immigrants from North Macedonia ($59,189, a difference of 0.60%), and Immigrants from Southern Europe ($59,217, a difference of 0.65%).
| Demographics | Rating | Rank | Median Male Earnings |
| Immigrants | Argentina | 99.3 /100 | #88 | Exceptional $59,491 |
| Immigrants | Moldova | 99.2 /100 | #89 | Exceptional $59,417 |
| Austrians | 99.2 /100 | #90 | Exceptional $59,359 |
| Laotians | 99.2 /100 | #91 | Exceptional $59,351 |
| Immigrants | Kazakhstan | 99.1 /100 | #92 | Exceptional $59,278 |
| Immigrants | Southern Europe | 99.0 /100 | #93 | Exceptional $59,217 |
| Immigrants | North Macedonia | 99.0 /100 | #94 | Exceptional $59,189 |
| Immigrants | Lebanon | 98.6 /100 | #95 | Exceptional $58,835 |
| Albanians | 98.4 /100 | #96 | Exceptional $58,680 |
| Northern Europeans | 98.2 /100 | #97 | Exceptional $58,588 |
| Jordanians | 98.1 /100 | #98 | Exceptional $58,500 |
| Immigrants | Poland | 98.0 /100 | #99 | Exceptional $58,452 |
| Assyrians/Chaldeans/Syriacs | 97.9 /100 | #100 | Exceptional $58,437 |
| Immigrants | Brazil | 97.7 /100 | #101 | Exceptional $58,324 |
| Syrians | 97.4 /100 | #102 | Exceptional $58,187 |