Korean vs English Median Male Earnings
COMPARE
Korean
English
Median Male Earnings
Median Male Earnings Comparison
Koreans
English
$56,672
MEDIAN MALE EARNINGS
89.4/ 100
METRIC RATING
130th/ 347
METRIC RANK
$55,747
MEDIAN MALE EARNINGS
77.4/ 100
METRIC RATING
149th/ 347
METRIC RANK
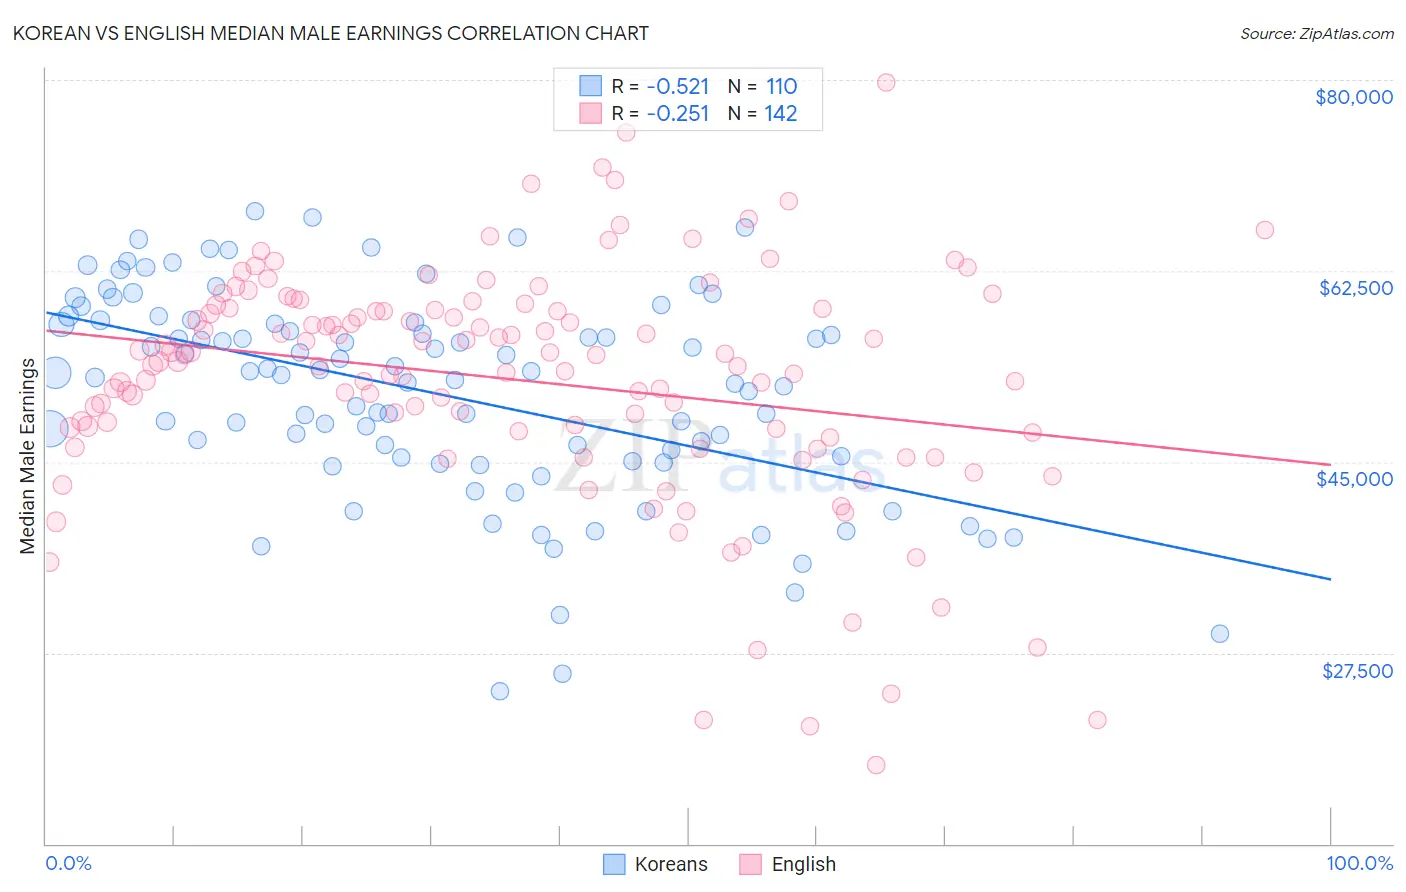
Korean vs English Median Male Earnings Correlation Chart
The statistical analysis conducted on geographies consisting of 510,664,628 people shows a substantial negative correlation between the proportion of Koreans and median male earnings in the United States with a correlation coefficient (R) of -0.521 and weighted average of $56,672. Similarly, the statistical analysis conducted on geographies consisting of 577,846,764 people shows a weak negative correlation between the proportion of English and median male earnings in the United States with a correlation coefficient (R) of -0.251 and weighted average of $55,747, a difference of 1.7%.
Median Male Earnings Correlation Summary
| Measurement | Korean | English |
| Minimum | $24,028 | $17,188 |
| Maximum | $67,994 | $79,824 |
| Range | $43,966 | $62,636 |
| Mean | $51,299 | $52,541 |
| Median | $53,093 | $54,211 |
| Interquartile 25% (IQ1) | $45,357 | $47,796 |
| Interquartile 75% (IQ3) | $57,742 | $58,992 |
| Interquartile Range (IQR) | $12,385 | $11,196 |
| Standard Deviation (Sample) | $9,399 | $10,836 |
| Standard Deviation (Population) | $9,356 | $10,798 |
Demographics Similar to Koreans and English by Median Male Earnings
In terms of median male earnings, the demographic groups most similar to Koreans are Portuguese ($56,663, a difference of 0.020%), Pakistani ($56,719, a difference of 0.080%), Czech ($56,546, a difference of 0.22%), Immigrants from Germany ($56,542, a difference of 0.23%), and Moroccan ($56,499, a difference of 0.31%). Similarly, the demographic groups most similar to English are Scottish ($55,793, a difference of 0.080%), Immigrants from Philippines ($55,809, a difference of 0.11%), Immigrants from Chile ($55,954, a difference of 0.37%), Norwegian ($55,965, a difference of 0.39%), and Immigrants from Uganda ($56,064, a difference of 0.57%).
| Demographics | Rating | Rank | Median Male Earnings |
| Pakistanis | 89.9 /100 | #129 | Excellent $56,719 |
| Koreans | 89.4 /100 | #130 | Excellent $56,672 |
| Portuguese | 89.4 /100 | #131 | Excellent $56,663 |
| Czechs | 88.2 /100 | #132 | Excellent $56,546 |
| Immigrants | Germany | 88.2 /100 | #133 | Excellent $56,542 |
| Moroccans | 87.7 /100 | #134 | Excellent $56,499 |
| Irish | 87.4 /100 | #135 | Excellent $56,464 |
| Immigrants | Saudi Arabia | 87.2 /100 | #136 | Excellent $56,452 |
| Slavs | 86.5 /100 | #137 | Excellent $56,390 |
| Slovaks | 85.5 /100 | #138 | Excellent $56,306 |
| Zimbabweans | 85.5 /100 | #139 | Excellent $56,302 |
| Luxembourgers | 85.5 /100 | #140 | Excellent $56,300 |
| Danes | 84.8 /100 | #141 | Excellent $56,246 |
| Ethiopians | 84.8 /100 | #142 | Excellent $56,243 |
| Sri Lankans | 83.4 /100 | #143 | Excellent $56,136 |
| Immigrants | Uganda | 82.4 /100 | #144 | Excellent $56,064 |
| Norwegians | 80.9 /100 | #145 | Excellent $55,965 |
| Immigrants | Chile | 80.7 /100 | #146 | Excellent $55,954 |
| Immigrants | Philippines | 78.4 /100 | #147 | Good $55,809 |
| Scottish | 78.2 /100 | #148 | Good $55,793 |
| English | 77.4 /100 | #149 | Good $55,747 |