Immigrants from Bosnia and Herzegovina vs Immigrants from Lebanon Median Male Earnings
COMPARE
Immigrants from Bosnia and Herzegovina
Immigrants from Lebanon
Median Male Earnings
Median Male Earnings Comparison
Immigrants from Bosnia and Herzegovina
Immigrants from Lebanon
$52,869
MEDIAN MALE EARNINGS
16.9/ 100
METRIC RATING
201st/ 347
METRIC RANK
$58,835
MEDIAN MALE EARNINGS
98.6/ 100
METRIC RATING
95th/ 347
METRIC RANK
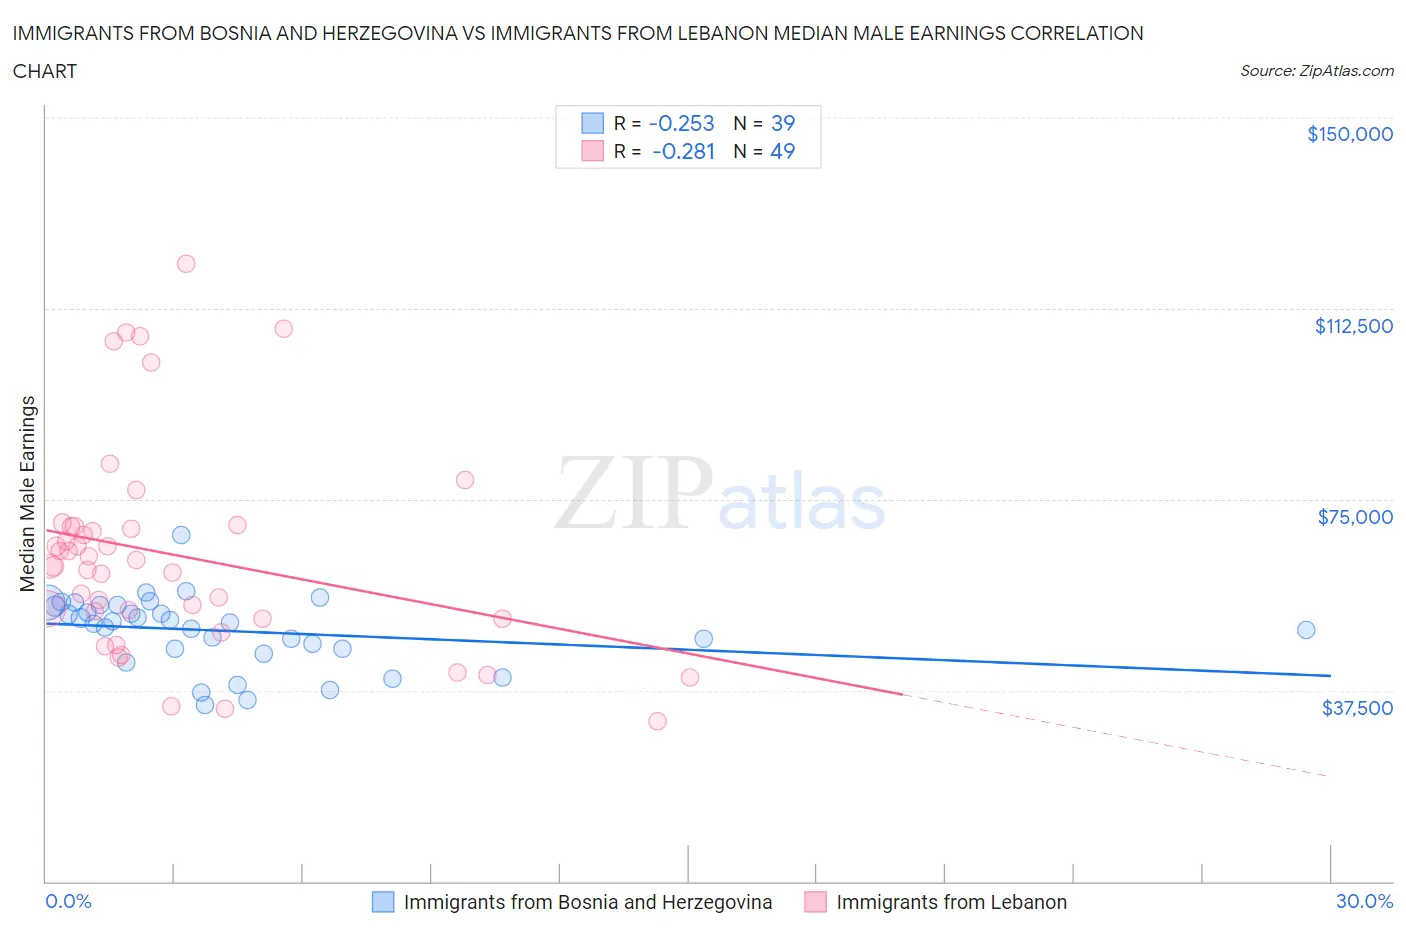
Immigrants from Bosnia and Herzegovina vs Immigrants from Lebanon Median Male Earnings Correlation Chart
The statistical analysis conducted on geographies consisting of 156,811,479 people shows a weak negative correlation between the proportion of Immigrants from Bosnia and Herzegovina and median male earnings in the United States with a correlation coefficient (R) of -0.253 and weighted average of $52,869. Similarly, the statistical analysis conducted on geographies consisting of 217,125,593 people shows a weak negative correlation between the proportion of Immigrants from Lebanon and median male earnings in the United States with a correlation coefficient (R) of -0.281 and weighted average of $58,835, a difference of 11.3%.
Median Male Earnings Correlation Summary
| Measurement | Immigrants from Bosnia and Herzegovina | Immigrants from Lebanon |
| Minimum | $34,670 | $31,325 |
| Maximum | $67,986 | $121,345 |
| Range | $33,316 | $90,020 |
| Mean | $49,159 | $64,055 |
| Median | $50,833 | $61,932 |
| Interquartile 25% (IQ1) | $45,544 | $51,586 |
| Interquartile 75% (IQ3) | $54,290 | $69,695 |
| Interquartile Range (IQR) | $8,746 | $18,109 |
| Standard Deviation (Sample) | $6,958 | $20,593 |
| Standard Deviation (Population) | $6,868 | $20,382 |
Similar Demographics by Median Male Earnings
Demographics Similar to Immigrants from Bosnia and Herzegovina by Median Male Earnings
In terms of median male earnings, the demographic groups most similar to Immigrants from Bosnia and Herzegovina are Immigrants from Uruguay ($52,860, a difference of 0.020%), Panamanian ($52,835, a difference of 0.060%), Immigrants from Thailand ($52,908, a difference of 0.070%), Ghanaian ($52,810, a difference of 0.11%), and Immigrants from Colombia ($52,725, a difference of 0.27%).
| Demographics | Rating | Rank | Median Male Earnings |
| Spanish | 29.0 /100 | #194 | Fair $53,576 |
| Immigrants | Azores | 27.5 /100 | #195 | Fair $53,503 |
| Immigrants | Africa | 26.6 /100 | #196 | Fair $53,457 |
| Immigrants | Kenya | 26.0 /100 | #197 | Fair $53,427 |
| Immigrants | Costa Rica | 22.6 /100 | #198 | Fair $53,237 |
| Tongans | 22.3 /100 | #199 | Fair $53,218 |
| Immigrants | Thailand | 17.5 /100 | #200 | Poor $52,908 |
| Immigrants | Bosnia and Herzegovina | 16.9 /100 | #201 | Poor $52,869 |
| Immigrants | Uruguay | 16.8 /100 | #202 | Poor $52,860 |
| Panamanians | 16.5 /100 | #203 | Poor $52,835 |
| Ghanaians | 16.1 /100 | #204 | Poor $52,810 |
| Immigrants | Colombia | 15.0 /100 | #205 | Poor $52,725 |
| Immigrants | Iraq | 14.5 /100 | #206 | Poor $52,681 |
| Vietnamese | 12.7 /100 | #207 | Poor $52,525 |
| Venezuelans | 12.5 /100 | #208 | Poor $52,510 |
Demographics Similar to Immigrants from Lebanon by Median Male Earnings
In terms of median male earnings, the demographic groups most similar to Immigrants from Lebanon are Albanian ($58,680, a difference of 0.27%), Northern European ($58,588, a difference of 0.42%), Jordanian ($58,500, a difference of 0.57%), Immigrants from North Macedonia ($59,189, a difference of 0.60%), and Immigrants from Southern Europe ($59,217, a difference of 0.65%).
| Demographics | Rating | Rank | Median Male Earnings |
| Immigrants | Argentina | 99.3 /100 | #88 | Exceptional $59,491 |
| Immigrants | Moldova | 99.2 /100 | #89 | Exceptional $59,417 |
| Austrians | 99.2 /100 | #90 | Exceptional $59,359 |
| Laotians | 99.2 /100 | #91 | Exceptional $59,351 |
| Immigrants | Kazakhstan | 99.1 /100 | #92 | Exceptional $59,278 |
| Immigrants | Southern Europe | 99.0 /100 | #93 | Exceptional $59,217 |
| Immigrants | North Macedonia | 99.0 /100 | #94 | Exceptional $59,189 |
| Immigrants | Lebanon | 98.6 /100 | #95 | Exceptional $58,835 |
| Albanians | 98.4 /100 | #96 | Exceptional $58,680 |
| Northern Europeans | 98.2 /100 | #97 | Exceptional $58,588 |
| Jordanians | 98.1 /100 | #98 | Exceptional $58,500 |
| Immigrants | Poland | 98.0 /100 | #99 | Exceptional $58,452 |
| Assyrians/Chaldeans/Syriacs | 97.9 /100 | #100 | Exceptional $58,437 |
| Immigrants | Brazil | 97.7 /100 | #101 | Exceptional $58,324 |
| Syrians | 97.4 /100 | #102 | Exceptional $58,187 |