Korean vs Immigrants from Lebanon Poverty
COMPARE
Korean
Immigrants from Lebanon
Poverty
Poverty Comparison
Koreans
Immigrants from Lebanon
10.9%
POVERTY
99.2/ 100
METRIC RATING
42nd/ 347
METRIC RANK
12.8%
POVERTY
18.7/ 100
METRIC RATING
197th/ 347
METRIC RANK
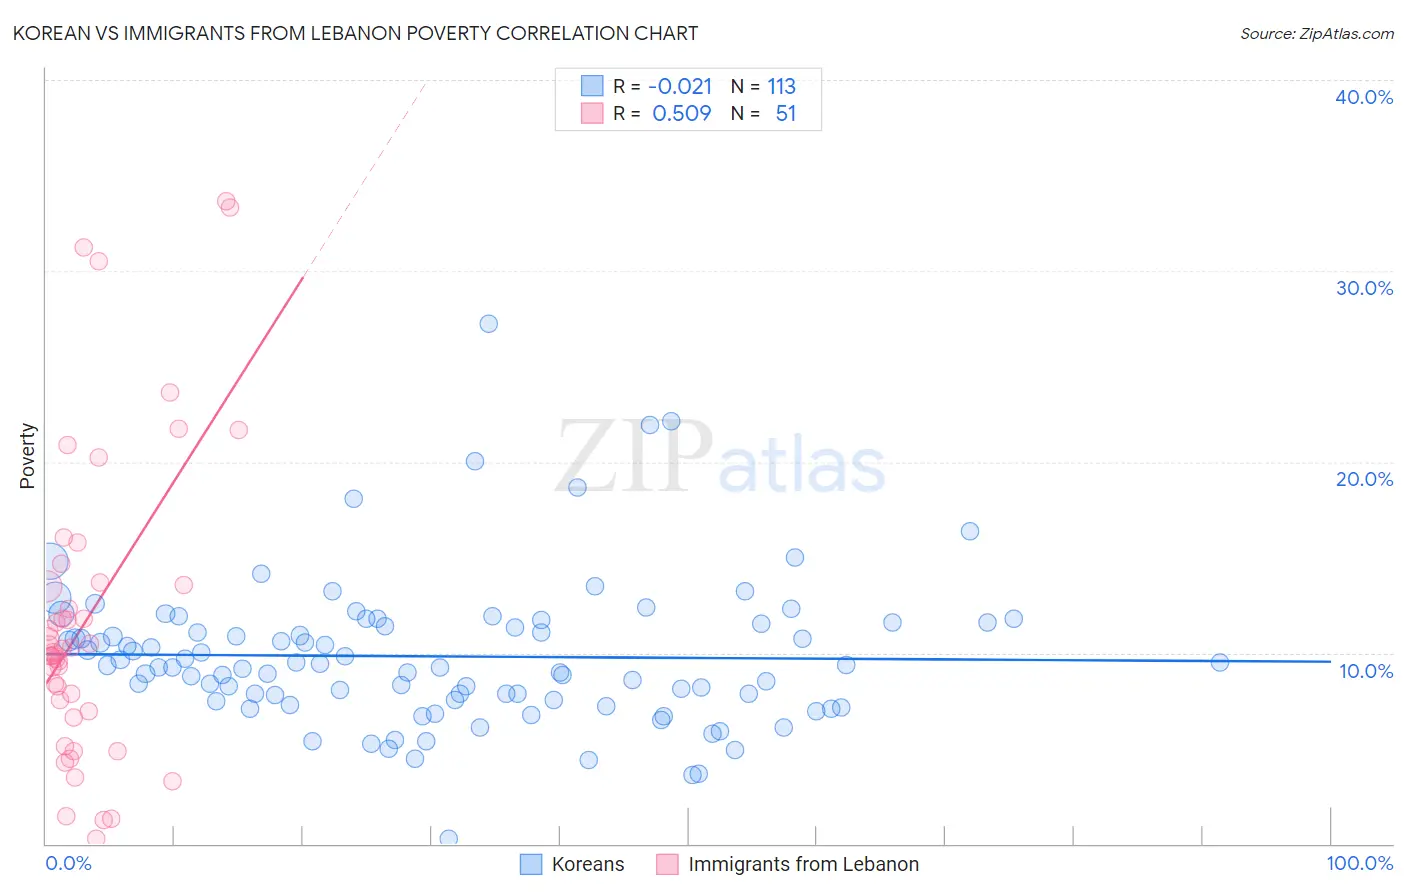
Korean vs Immigrants from Lebanon Poverty Correlation Chart
The statistical analysis conducted on geographies consisting of 510,388,718 people shows no correlation between the proportion of Koreans and poverty level in the United States with a correlation coefficient (R) of -0.021 and weighted average of 10.9%. Similarly, the statistical analysis conducted on geographies consisting of 217,129,888 people shows a substantial positive correlation between the proportion of Immigrants from Lebanon and poverty level in the United States with a correlation coefficient (R) of 0.509 and weighted average of 12.8%, a difference of 17.2%.
Poverty Correlation Summary
| Measurement | Korean | Immigrants from Lebanon |
| Minimum | 0.27% | 0.24% |
| Maximum | 27.2% | 33.6% |
| Range | 27.0% | 33.4% |
| Mean | 9.8% | 11.8% |
| Median | 9.3% | 10.2% |
| Interquartile 25% (IQ1) | 7.5% | 6.9% |
| Interquartile 75% (IQ3) | 11.6% | 13.7% |
| Interquartile Range (IQR) | 4.0% | 6.8% |
| Standard Deviation (Sample) | 3.9% | 8.0% |
| Standard Deviation (Population) | 3.8% | 7.9% |
Similar Demographics by Poverty
Demographics Similar to Koreans by Poverty
In terms of poverty, the demographic groups most similar to Koreans are Immigrants from Singapore (10.9%, a difference of 0.050%), Immigrants from Moldova (10.9%, a difference of 0.19%), Immigrants from Iran (10.9%, a difference of 0.22%), Russian (10.9%, a difference of 0.31%), and Immigrants from Pakistan (10.8%, a difference of 0.36%).
| Demographics | Rating | Rank | Poverty |
| Tongans | 99.4 /100 | #35 | Exceptional 10.8% |
| Cypriots | 99.3 /100 | #36 | Exceptional 10.8% |
| Immigrants | Greece | 99.3 /100 | #37 | Exceptional 10.8% |
| Czechs | 99.3 /100 | #38 | Exceptional 10.8% |
| Immigrants | Pakistan | 99.3 /100 | #39 | Exceptional 10.8% |
| Russians | 99.3 /100 | #40 | Exceptional 10.9% |
| Immigrants | Iran | 99.2 /100 | #41 | Exceptional 10.9% |
| Koreans | 99.2 /100 | #42 | Exceptional 10.9% |
| Immigrants | Singapore | 99.2 /100 | #43 | Exceptional 10.9% |
| Immigrants | Moldova | 99.1 /100 | #44 | Exceptional 10.9% |
| Turks | 98.9 /100 | #45 | Exceptional 11.0% |
| Immigrants | Czechoslovakia | 98.9 /100 | #46 | Exceptional 11.0% |
| Immigrants | Romania | 98.9 /100 | #47 | Exceptional 11.0% |
| Slovenes | 98.9 /100 | #48 | Exceptional 11.0% |
| Immigrants | Japan | 98.9 /100 | #49 | Exceptional 11.0% |
Demographics Similar to Immigrants from Lebanon by Poverty
In terms of poverty, the demographic groups most similar to Immigrants from Lebanon are Spanish (12.8%, a difference of 0.010%), Immigrants from Kenya (12.8%, a difference of 0.20%), Iraqi (12.7%, a difference of 0.31%), Immigrants from Kuwait (12.7%, a difference of 0.32%), and Spaniard (12.8%, a difference of 0.35%).
| Demographics | Rating | Rank | Poverty |
| Immigrants | South America | 32.3 /100 | #190 | Fair 12.5% |
| Sierra Leoneans | 31.5 /100 | #191 | Fair 12.6% |
| South American Indians | 23.3 /100 | #192 | Fair 12.7% |
| Delaware | 21.4 /100 | #193 | Fair 12.7% |
| Arabs | 21.1 /100 | #194 | Fair 12.7% |
| Immigrants | Kuwait | 20.9 /100 | #195 | Fair 12.7% |
| Iraqis | 20.8 /100 | #196 | Fair 12.7% |
| Immigrants | Lebanon | 18.7 /100 | #197 | Poor 12.8% |
| Spanish | 18.7 /100 | #198 | Poor 12.8% |
| Immigrants | Kenya | 17.5 /100 | #199 | Poor 12.8% |
| Spaniards | 16.5 /100 | #200 | Poor 12.8% |
| Immigrants | Uganda | 16.5 /100 | #201 | Poor 12.8% |
| Immigrants | Uruguay | 15.6 /100 | #202 | Poor 12.8% |
| Hmong | 15.0 /100 | #203 | Poor 12.8% |
| Immigrants | Western Asia | 14.1 /100 | #204 | Poor 12.9% |