Korean vs Welsh Median Male Earnings
COMPARE
Korean
Welsh
Median Male Earnings
Median Male Earnings Comparison
Koreans
Welsh
$56,672
MEDIAN MALE EARNINGS
89.4/ 100
METRIC RATING
130th/ 347
METRIC RANK
$54,647
MEDIAN MALE EARNINGS
53.8/ 100
METRIC RATING
172nd/ 347
METRIC RANK
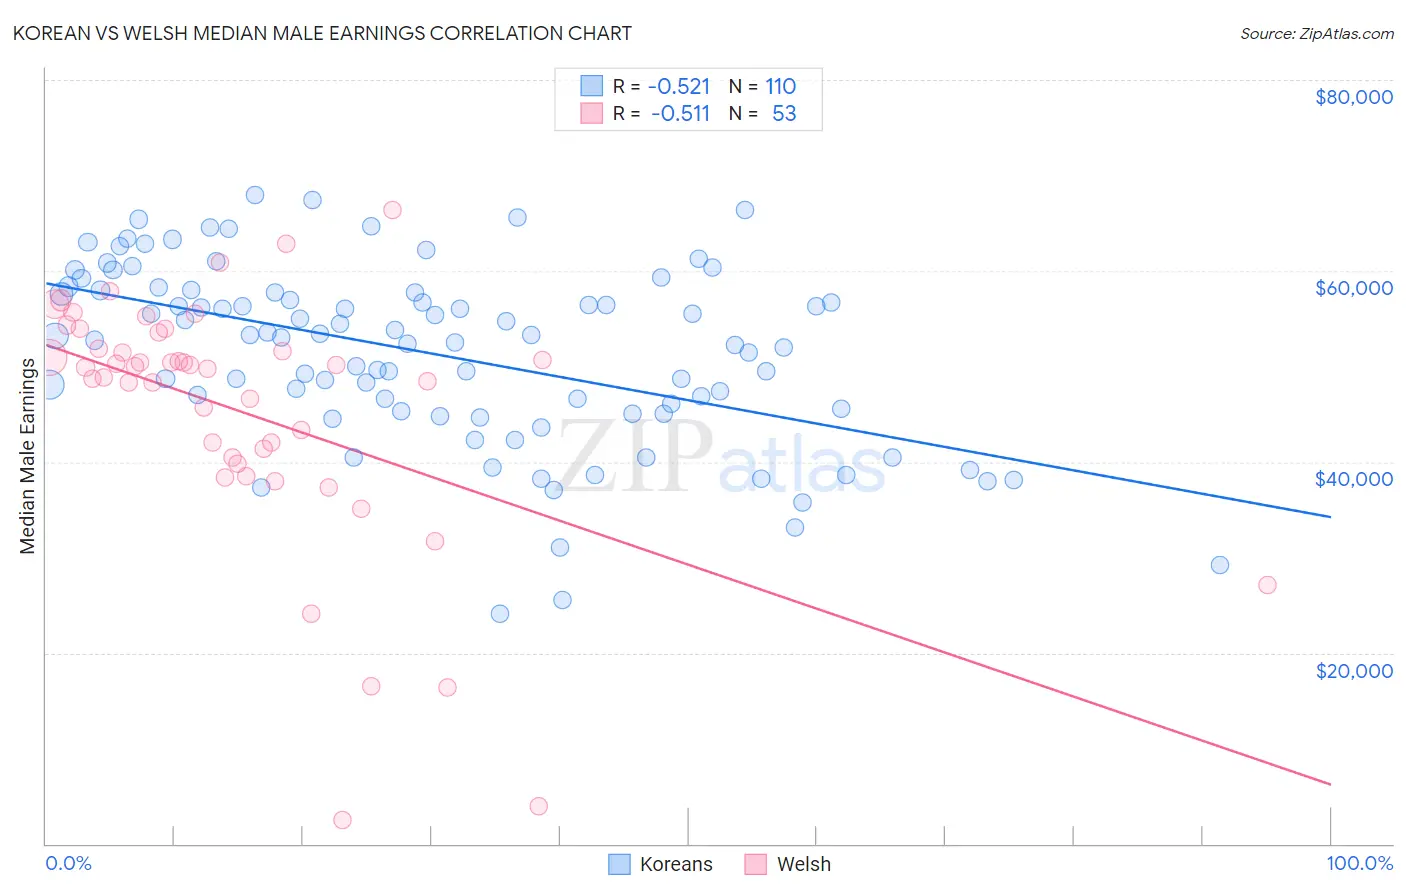
Korean vs Welsh Median Male Earnings Correlation Chart
The statistical analysis conducted on geographies consisting of 510,664,628 people shows a substantial negative correlation between the proportion of Koreans and median male earnings in the United States with a correlation coefficient (R) of -0.521 and weighted average of $56,672. Similarly, the statistical analysis conducted on geographies consisting of 527,949,095 people shows a substantial negative correlation between the proportion of Welsh and median male earnings in the United States with a correlation coefficient (R) of -0.511 and weighted average of $54,647, a difference of 3.7%.
Median Male Earnings Correlation Summary
| Measurement | Korean | Welsh |
| Minimum | $24,028 | $2,499 |
| Maximum | $67,994 | $66,364 |
| Range | $43,966 | $63,865 |
| Mean | $51,299 | $45,194 |
| Median | $53,093 | $49,839 |
| Interquartile 25% (IQ1) | $45,357 | $40,118 |
| Interquartile 75% (IQ3) | $57,742 | $52,741 |
| Interquartile Range (IQR) | $12,385 | $12,623 |
| Standard Deviation (Sample) | $9,399 | $13,217 |
| Standard Deviation (Population) | $9,356 | $13,092 |
Similar Demographics by Median Male Earnings
Demographics Similar to Koreans by Median Male Earnings
In terms of median male earnings, the demographic groups most similar to Koreans are Portuguese ($56,663, a difference of 0.020%), Pakistani ($56,719, a difference of 0.080%), Czech ($56,546, a difference of 0.22%), Immigrants from Germany ($56,542, a difference of 0.23%), and Immigrants from Syria ($56,830, a difference of 0.28%).
| Demographics | Rating | Rank | Median Male Earnings |
| Slovenes | 93.1 /100 | #123 | Exceptional $57,145 |
| Chileans | 91.9 /100 | #124 | Exceptional $56,973 |
| Immigrants | Morocco | 91.8 /100 | #125 | Exceptional $56,958 |
| Chinese | 91.1 /100 | #126 | Exceptional $56,872 |
| Brazilians | 90.9 /100 | #127 | Exceptional $56,837 |
| Immigrants | Syria | 90.8 /100 | #128 | Exceptional $56,830 |
| Pakistanis | 89.9 /100 | #129 | Excellent $56,719 |
| Koreans | 89.4 /100 | #130 | Excellent $56,672 |
| Portuguese | 89.4 /100 | #131 | Excellent $56,663 |
| Czechs | 88.2 /100 | #132 | Excellent $56,546 |
| Immigrants | Germany | 88.2 /100 | #133 | Excellent $56,542 |
| Moroccans | 87.7 /100 | #134 | Excellent $56,499 |
| Irish | 87.4 /100 | #135 | Excellent $56,464 |
| Immigrants | Saudi Arabia | 87.2 /100 | #136 | Excellent $56,452 |
| Slavs | 86.5 /100 | #137 | Excellent $56,390 |
Demographics Similar to Welsh by Median Male Earnings
In terms of median male earnings, the demographic groups most similar to Welsh are Immigrants from Peru ($54,695, a difference of 0.090%), French Canadian ($54,722, a difference of 0.14%), Finnish ($54,721, a difference of 0.14%), South American Indian ($54,508, a difference of 0.25%), and South American ($54,492, a difference of 0.28%).
| Demographics | Rating | Rank | Median Male Earnings |
| Immigrants | Portugal | 66.3 /100 | #165 | Good $55,182 |
| Germans | 61.6 /100 | #166 | Good $54,974 |
| Immigrants | Fiji | 61.2 /100 | #167 | Good $54,958 |
| Immigrants | Vietnam | 60.2 /100 | #168 | Good $54,913 |
| French Canadians | 55.6 /100 | #169 | Average $54,722 |
| Finns | 55.6 /100 | #170 | Average $54,721 |
| Immigrants | Peru | 54.9 /100 | #171 | Average $54,695 |
| Welsh | 53.8 /100 | #172 | Average $54,647 |
| South American Indians | 50.4 /100 | #173 | Average $54,508 |
| South Americans | 50.0 /100 | #174 | Average $54,492 |
| Dutch | 48.0 /100 | #175 | Average $54,410 |
| Spaniards | 47.8 /100 | #176 | Average $54,401 |
| Costa Ricans | 44.8 /100 | #177 | Average $54,279 |
| Sierra Leoneans | 44.8 /100 | #178 | Average $54,279 |
| Celtics | 43.9 /100 | #179 | Average $54,242 |