Korean vs Immigrants from Lebanon Median Female Earnings
COMPARE
Korean
Immigrants from Lebanon
Median Female Earnings
Median Female Earnings Comparison
Koreans
Immigrants from Lebanon
$41,276
MEDIAN FEMALE EARNINGS
96.4/ 100
METRIC RATING
115th/ 347
METRIC RANK
$41,183
MEDIAN FEMALE EARNINGS
95.6/ 100
METRIC RATING
118th/ 347
METRIC RANK
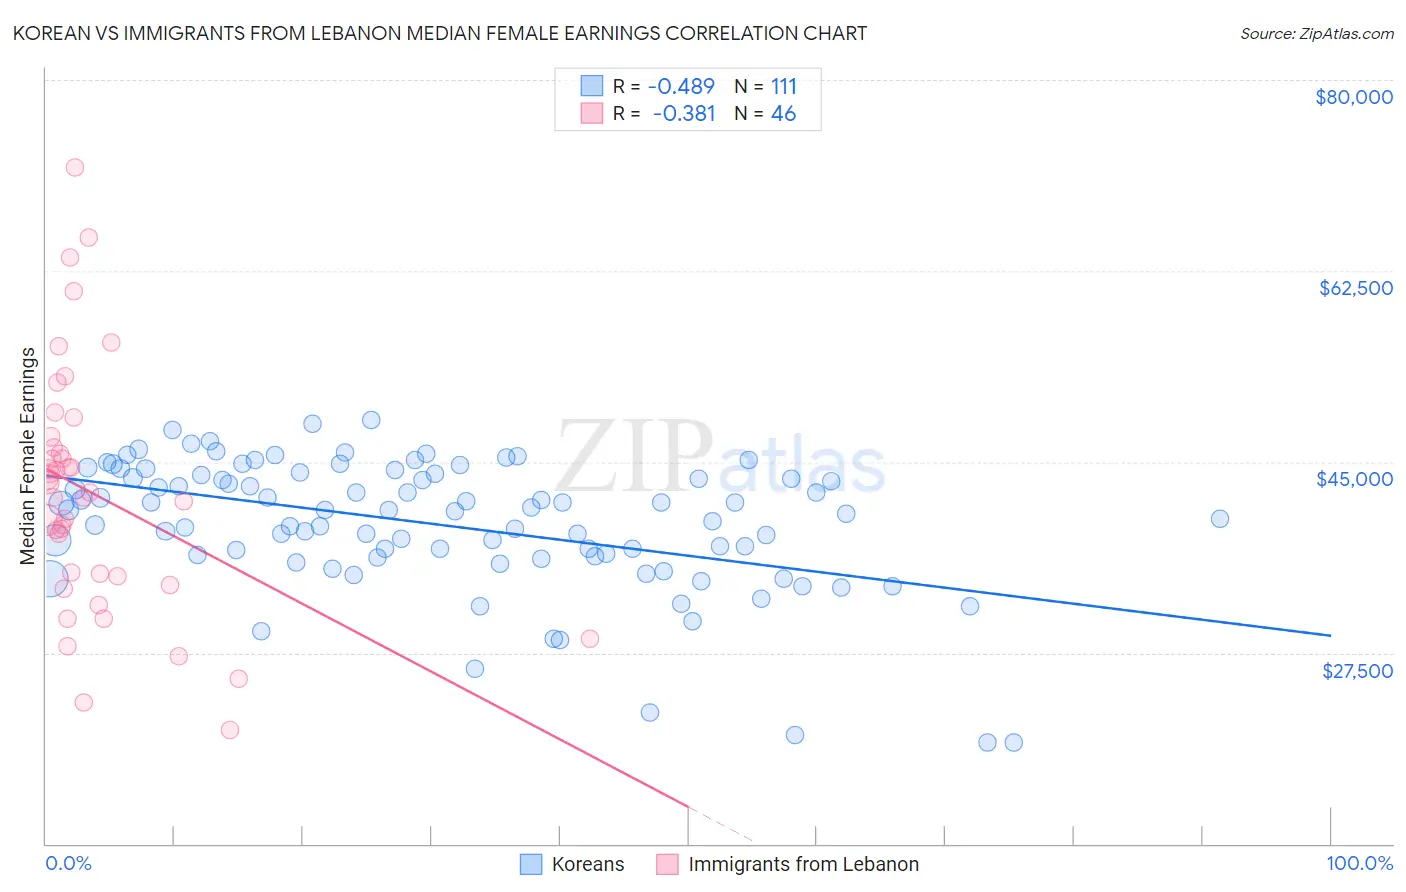
Korean vs Immigrants from Lebanon Median Female Earnings Correlation Chart
The statistical analysis conducted on geographies consisting of 510,529,365 people shows a moderate negative correlation between the proportion of Koreans and median female earnings in the United States with a correlation coefficient (R) of -0.489 and weighted average of $41,276. Similarly, the statistical analysis conducted on geographies consisting of 217,136,243 people shows a mild negative correlation between the proportion of Immigrants from Lebanon and median female earnings in the United States with a correlation coefficient (R) of -0.381 and weighted average of $41,183, a difference of 0.23%.
Median Female Earnings Correlation Summary
| Measurement | Korean | Immigrants from Lebanon |
| Minimum | $19,330 | $20,406 |
| Maximum | $48,873 | $72,000 |
| Range | $29,543 | $51,594 |
| Mean | $39,268 | $42,035 |
| Median | $40,570 | $41,983 |
| Interquartile 25% (IQ1) | $36,354 | $34,539 |
| Interquartile 75% (IQ3) | $43,801 | $46,364 |
| Interquartile Range (IQR) | $7,447 | $11,825 |
| Standard Deviation (Sample) | $6,022 | $11,071 |
| Standard Deviation (Population) | $5,995 | $10,950 |
Demographics Similar to Koreans and Immigrants from Lebanon by Median Female Earnings
In terms of median female earnings, the demographic groups most similar to Koreans are Immigrants from England ($41,277, a difference of 0.0%), Immigrants from Brazil ($41,273, a difference of 0.010%), Macedonian ($41,286, a difference of 0.020%), Barbadian ($41,261, a difference of 0.040%), and Immigrants from North America ($41,319, a difference of 0.10%). Similarly, the demographic groups most similar to Immigrants from Lebanon are Immigrants from Philippines ($41,114, a difference of 0.17%), Barbadian ($41,261, a difference of 0.19%), Immigrants from Brazil ($41,273, a difference of 0.22%), Immigrants from England ($41,277, a difference of 0.23%), and Macedonian ($41,286, a difference of 0.25%).
| Demographics | Rating | Rank | Median Female Earnings |
| Immigrants | Eritrea | 97.6 /100 | #106 | Exceptional $41,485 |
| Palestinians | 97.6 /100 | #107 | Exceptional $41,484 |
| Jordanians | 97.5 /100 | #108 | Exceptional $41,464 |
| Chinese | 97.5 /100 | #109 | Exceptional $41,461 |
| Immigrants | Western Asia | 97.0 /100 | #110 | Exceptional $41,375 |
| Immigrants | Canada | 97.0 /100 | #111 | Exceptional $41,373 |
| Immigrants | North America | 96.7 /100 | #112 | Exceptional $41,319 |
| Macedonians | 96.4 /100 | #113 | Exceptional $41,286 |
| Immigrants | England | 96.4 /100 | #114 | Exceptional $41,277 |
| Koreans | 96.4 /100 | #115 | Exceptional $41,276 |
| Immigrants | Brazil | 96.4 /100 | #116 | Exceptional $41,273 |
| Barbadians | 96.3 /100 | #117 | Exceptional $41,261 |
| Immigrants | Lebanon | 95.6 /100 | #118 | Exceptional $41,183 |
| Immigrants | Philippines | 95.0 /100 | #119 | Exceptional $41,114 |
| Immigrants | Kuwait | 94.4 /100 | #120 | Exceptional $41,055 |
| Croatians | 93.7 /100 | #121 | Exceptional $40,993 |
| Immigrants | Jordan | 93.5 /100 | #122 | Exceptional $40,977 |
| Guyanese | 93.4 /100 | #123 | Exceptional $40,973 |
| Trinidadians and Tobagonians | 93.2 /100 | #124 | Exceptional $40,958 |
| Austrians | 92.7 /100 | #125 | Exceptional $40,923 |
| Immigrants | Trinidad and Tobago | 92.3 /100 | #126 | Exceptional $40,895 |