Korean vs Argentinean Median Male Earnings
COMPARE
Korean
Argentinean
Median Male Earnings
Median Male Earnings Comparison
Koreans
Argentineans
$56,672
MEDIAN MALE EARNINGS
89.4/ 100
METRIC RATING
130th/ 347
METRIC RANK
$60,117
MEDIAN MALE EARNINGS
99.6/ 100
METRIC RATING
74th/ 347
METRIC RANK
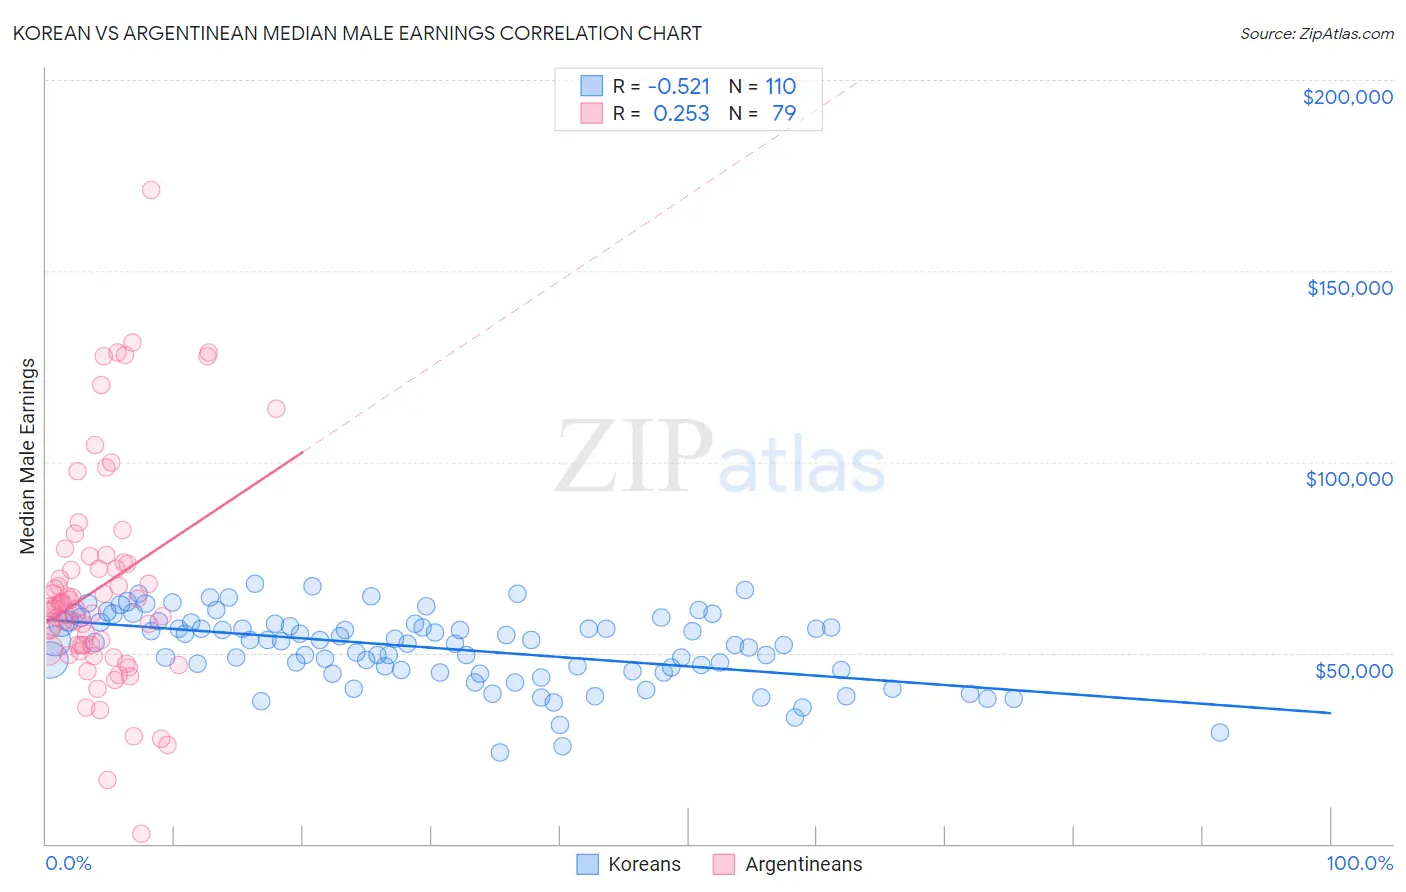
Korean vs Argentinean Median Male Earnings Correlation Chart
The statistical analysis conducted on geographies consisting of 510,664,628 people shows a substantial negative correlation between the proportion of Koreans and median male earnings in the United States with a correlation coefficient (R) of -0.521 and weighted average of $56,672. Similarly, the statistical analysis conducted on geographies consisting of 297,106,472 people shows a weak positive correlation between the proportion of Argentineans and median male earnings in the United States with a correlation coefficient (R) of 0.253 and weighted average of $60,117, a difference of 6.1%.
Median Male Earnings Correlation Summary
| Measurement | Korean | Argentinean |
| Minimum | $24,028 | $2,499 |
| Maximum | $67,994 | $171,304 |
| Range | $43,966 | $168,805 |
| Mean | $51,299 | $67,306 |
| Median | $53,093 | $61,977 |
| Interquartile 25% (IQ1) | $45,357 | $50,898 |
| Interquartile 75% (IQ3) | $57,742 | $73,533 |
| Interquartile Range (IQR) | $12,385 | $22,635 |
| Standard Deviation (Sample) | $9,399 | $28,973 |
| Standard Deviation (Population) | $9,356 | $28,789 |
Similar Demographics by Median Male Earnings
Demographics Similar to Koreans by Median Male Earnings
In terms of median male earnings, the demographic groups most similar to Koreans are Portuguese ($56,663, a difference of 0.020%), Pakistani ($56,719, a difference of 0.080%), Czech ($56,546, a difference of 0.22%), Immigrants from Germany ($56,542, a difference of 0.23%), and Immigrants from Syria ($56,830, a difference of 0.28%).
| Demographics | Rating | Rank | Median Male Earnings |
| Slovenes | 93.1 /100 | #123 | Exceptional $57,145 |
| Chileans | 91.9 /100 | #124 | Exceptional $56,973 |
| Immigrants | Morocco | 91.8 /100 | #125 | Exceptional $56,958 |
| Chinese | 91.1 /100 | #126 | Exceptional $56,872 |
| Brazilians | 90.9 /100 | #127 | Exceptional $56,837 |
| Immigrants | Syria | 90.8 /100 | #128 | Exceptional $56,830 |
| Pakistanis | 89.9 /100 | #129 | Excellent $56,719 |
| Koreans | 89.4 /100 | #130 | Excellent $56,672 |
| Portuguese | 89.4 /100 | #131 | Excellent $56,663 |
| Czechs | 88.2 /100 | #132 | Excellent $56,546 |
| Immigrants | Germany | 88.2 /100 | #133 | Excellent $56,542 |
| Moroccans | 87.7 /100 | #134 | Excellent $56,499 |
| Irish | 87.4 /100 | #135 | Excellent $56,464 |
| Immigrants | Saudi Arabia | 87.2 /100 | #136 | Excellent $56,452 |
| Slavs | 86.5 /100 | #137 | Excellent $56,390 |
Demographics Similar to Argentineans by Median Male Earnings
In terms of median male earnings, the demographic groups most similar to Argentineans are Immigrants from Bolivia ($60,088, a difference of 0.050%), Romanian ($60,063, a difference of 0.090%), Paraguayan ($59,975, a difference of 0.24%), Immigrants from North America ($60,265, a difference of 0.25%), and Immigrants from Egypt ($59,925, a difference of 0.32%).
| Demographics | Rating | Rank | Median Male Earnings |
| Immigrants | Spain | 99.8 /100 | #67 | Exceptional $60,750 |
| Immigrants | Serbia | 99.7 /100 | #68 | Exceptional $60,600 |
| Immigrants | Canada | 99.7 /100 | #69 | Exceptional $60,388 |
| Immigrants | Bulgaria | 99.7 /100 | #70 | Exceptional $60,358 |
| Mongolians | 99.7 /100 | #71 | Exceptional $60,350 |
| Immigrants | Western Europe | 99.7 /100 | #72 | Exceptional $60,334 |
| Immigrants | North America | 99.7 /100 | #73 | Exceptional $60,265 |
| Argentineans | 99.6 /100 | #74 | Exceptional $60,117 |
| Immigrants | Bolivia | 99.6 /100 | #75 | Exceptional $60,088 |
| Romanians | 99.6 /100 | #76 | Exceptional $60,063 |
| Paraguayans | 99.5 /100 | #77 | Exceptional $59,975 |
| Immigrants | Egypt | 99.5 /100 | #78 | Exceptional $59,925 |
| Immigrants | Ukraine | 99.5 /100 | #79 | Exceptional $59,820 |
| Immigrants | Hungary | 99.5 /100 | #80 | Exceptional $59,806 |
| Ukrainians | 99.4 /100 | #81 | Exceptional $59,728 |