Japanese vs Lumbee Median Family Income
COMPARE
Japanese
Lumbee
Median Family Income
Median Family Income Comparison
Japanese
Lumbee
$97,288
MEDIAN FAMILY INCOME
6.0/ 100
METRIC RATING
217th/ 347
METRIC RANK
$68,679
MEDIAN FAMILY INCOME
0.0/ 100
METRIC RATING
347th/ 347
METRIC RANK
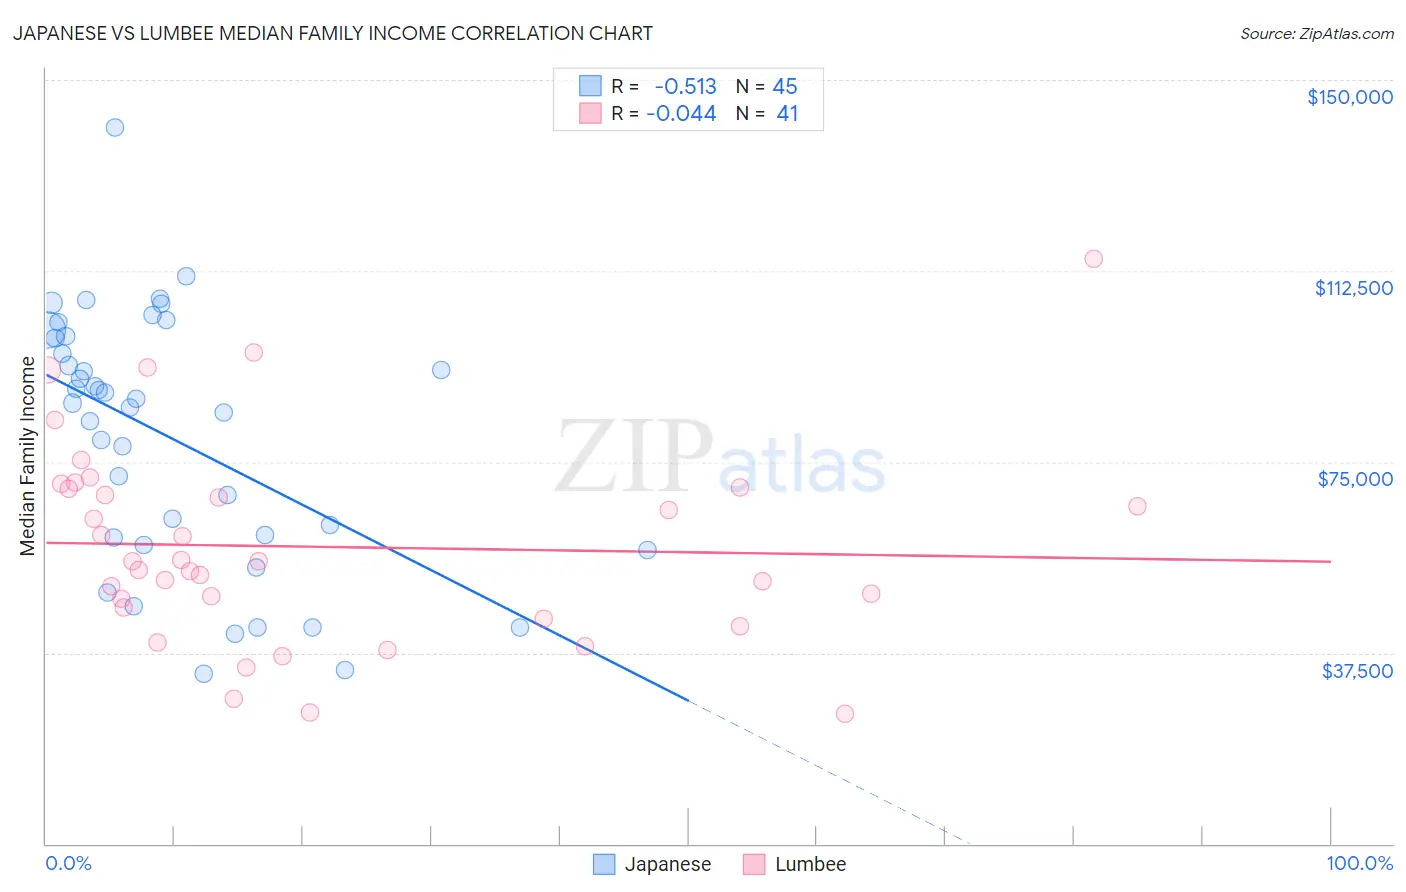
Japanese vs Lumbee Median Family Income Correlation Chart
The statistical analysis conducted on geographies consisting of 249,024,827 people shows a substantial negative correlation between the proportion of Japanese and median family income in the United States with a correlation coefficient (R) of -0.513 and weighted average of $97,288. Similarly, the statistical analysis conducted on geographies consisting of 92,247,043 people shows no correlation between the proportion of Lumbee and median family income in the United States with a correlation coefficient (R) of -0.044 and weighted average of $68,679, a difference of 41.7%.
Median Family Income Correlation Summary
| Measurement | Japanese | Lumbee |
| Minimum | $33,448 | $25,481 |
| Maximum | $140,649 | $114,792 |
| Range | $107,201 | $89,311 |
| Mean | $79,706 | $58,324 |
| Median | $86,545 | $55,406 |
| Interquartile 25% (IQ1) | $59,337 | $45,288 |
| Interquartile 75% (IQ3) | $99,518 | $69,902 |
| Interquartile Range (IQR) | $40,181 | $24,614 |
| Standard Deviation (Sample) | $24,734 | $19,662 |
| Standard Deviation (Population) | $24,457 | $19,420 |
Similar Demographics by Median Family Income
Demographics Similar to Japanese by Median Family Income
In terms of median family income, the demographic groups most similar to Japanese are Immigrants from Cambodia ($97,222, a difference of 0.070%), Immigrants from Bosnia and Herzegovina ($97,432, a difference of 0.15%), Nigerian ($97,522, a difference of 0.24%), Bermudan ($97,577, a difference of 0.30%), and Immigrants from Armenia ($97,605, a difference of 0.33%).
| Demographics | Rating | Rank | Median Family Income |
| Puget Sound Salish | 8.2 /100 | #210 | Tragic $97,958 |
| Immigrants | Sudan | 7.4 /100 | #211 | Tragic $97,737 |
| Panamanians | 7.2 /100 | #212 | Tragic $97,683 |
| Immigrants | Armenia | 7.0 /100 | #213 | Tragic $97,605 |
| Bermudans | 6.9 /100 | #214 | Tragic $97,577 |
| Nigerians | 6.7 /100 | #215 | Tragic $97,522 |
| Immigrants | Bosnia and Herzegovina | 6.4 /100 | #216 | Tragic $97,432 |
| Japanese | 6.0 /100 | #217 | Tragic $97,288 |
| Immigrants | Cambodia | 5.8 /100 | #218 | Tragic $97,222 |
| Delaware | 5.1 /100 | #219 | Tragic $96,958 |
| Sudanese | 4.7 /100 | #220 | Tragic $96,783 |
| Immigrants | Ghana | 4.2 /100 | #221 | Tragic $96,544 |
| Immigrants | Nigeria | 4.0 /100 | #222 | Tragic $96,439 |
| Venezuelans | 3.7 /100 | #223 | Tragic $96,281 |
| Immigrants | Nonimmigrants | 3.6 /100 | #224 | Tragic $96,231 |
Demographics Similar to Lumbee by Median Family Income
In terms of median family income, the demographic groups most similar to Lumbee are Puerto Rican ($70,423, a difference of 2.5%), Navajo ($70,989, a difference of 3.4%), Tohono O'odham ($72,193, a difference of 5.1%), Houma ($76,188, a difference of 10.9%), and Crow ($76,605, a difference of 11.5%).
| Demographics | Rating | Rank | Median Family Income |
| Kiowa | 0.0 /100 | #333 | Tragic $80,885 |
| Menominee | 0.0 /100 | #334 | Tragic $79,563 |
| Yup'ik | 0.0 /100 | #335 | Tragic $79,290 |
| Immigrants | Cuba | 0.0 /100 | #336 | Tragic $78,249 |
| Yuman | 0.0 /100 | #337 | Tragic $78,055 |
| Immigrants | Yemen | 0.0 /100 | #338 | Tragic $77,457 |
| Pima | 0.0 /100 | #339 | Tragic $77,431 |
| Hopi | 0.0 /100 | #340 | Tragic $77,188 |
| Pueblo | 0.0 /100 | #341 | Tragic $76,880 |
| Crow | 0.0 /100 | #342 | Tragic $76,605 |
| Houma | 0.0 /100 | #343 | Tragic $76,188 |
| Tohono O'odham | 0.0 /100 | #344 | Tragic $72,193 |
| Navajo | 0.0 /100 | #345 | Tragic $70,989 |
| Puerto Ricans | 0.0 /100 | #346 | Tragic $70,423 |
| Lumbee | 0.0 /100 | #347 | Tragic $68,679 |