Estonian vs Lumbee Median Family Income
COMPARE
Estonian
Lumbee
Median Family Income
Median Family Income Comparison
Estonians
Lumbee
$118,013
MEDIAN FAMILY INCOME
100.0/ 100
METRIC RATING
41st/ 347
METRIC RANK
$68,679
MEDIAN FAMILY INCOME
0.0/ 100
METRIC RATING
347th/ 347
METRIC RANK
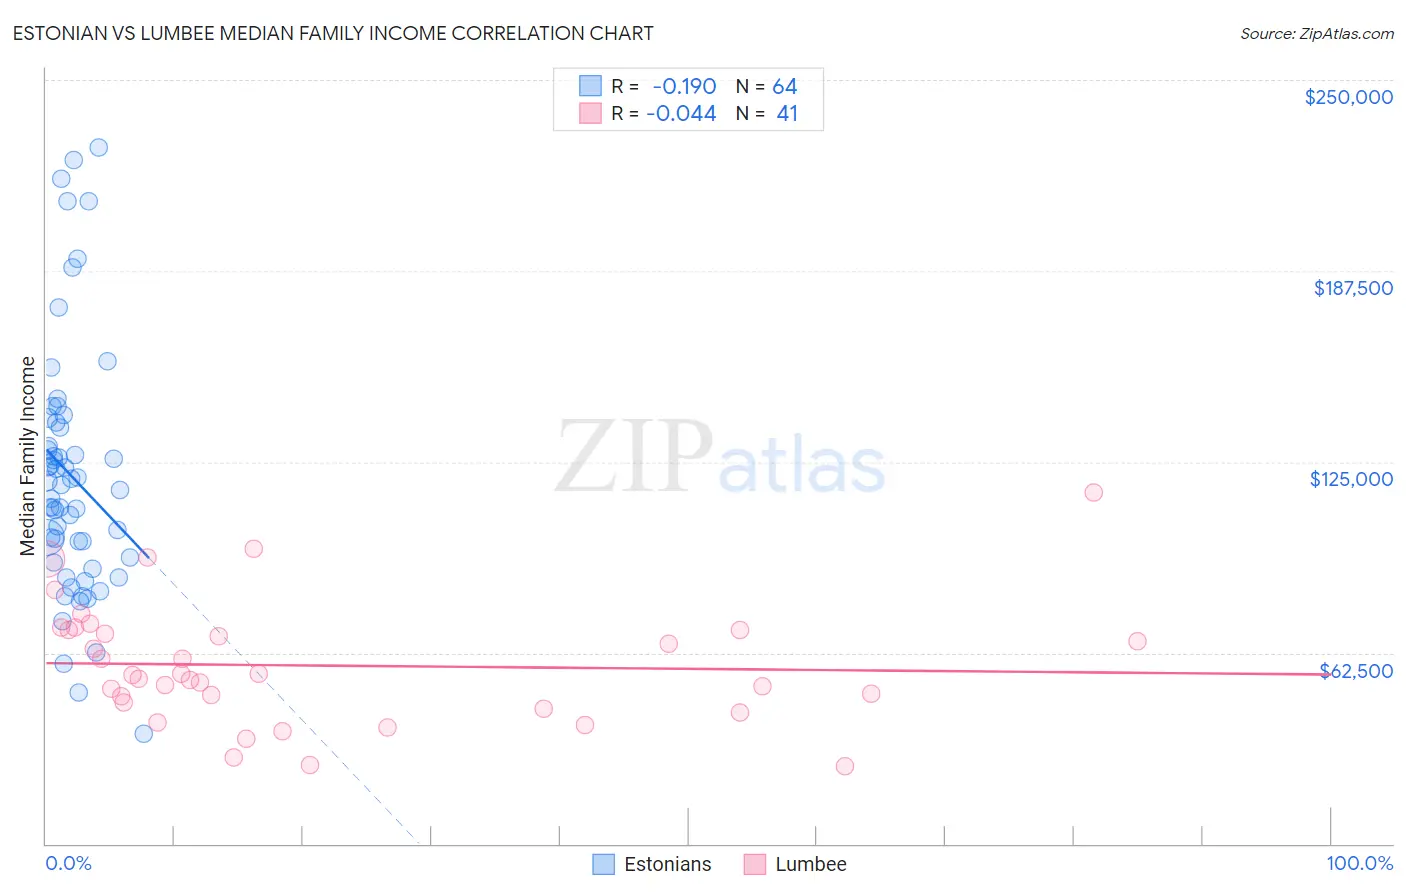
Estonian vs Lumbee Median Family Income Correlation Chart
The statistical analysis conducted on geographies consisting of 123,476,939 people shows a poor negative correlation between the proportion of Estonians and median family income in the United States with a correlation coefficient (R) of -0.190 and weighted average of $118,013. Similarly, the statistical analysis conducted on geographies consisting of 92,247,043 people shows no correlation between the proportion of Lumbee and median family income in the United States with a correlation coefficient (R) of -0.044 and weighted average of $68,679, a difference of 71.8%.
Median Family Income Correlation Summary
| Measurement | Estonian | Lumbee |
| Minimum | $35,938 | $25,481 |
| Maximum | $228,043 | $114,792 |
| Range | $192,105 | $89,311 |
| Mean | $120,304 | $58,324 |
| Median | $116,733 | $55,406 |
| Interquartile 25% (IQ1) | $92,790 | $45,288 |
| Interquartile 75% (IQ3) | $137,031 | $69,902 |
| Interquartile Range (IQR) | $44,241 | $24,614 |
| Standard Deviation (Sample) | $41,178 | $19,662 |
| Standard Deviation (Population) | $40,855 | $19,420 |
Similar Demographics by Median Family Income
Demographics Similar to Estonians by Median Family Income
In terms of median family income, the demographic groups most similar to Estonians are Immigrants from Lithuania ($118,053, a difference of 0.030%), Immigrants from Bolivia ($117,912, a difference of 0.090%), Bulgarian ($117,818, a difference of 0.17%), Cambodian ($117,780, a difference of 0.20%), and Immigrants from Asia ($118,291, a difference of 0.24%).
| Demographics | Rating | Rank | Median Family Income |
| Bolivians | 100.0 /100 | #34 | Exceptional $119,479 |
| Soviet Union | 100.0 /100 | #35 | Exceptional $119,262 |
| Israelis | 100.0 /100 | #36 | Exceptional $118,577 |
| Australians | 100.0 /100 | #37 | Exceptional $118,440 |
| Immigrants | Turkey | 100.0 /100 | #38 | Exceptional $118,325 |
| Immigrants | Asia | 100.0 /100 | #39 | Exceptional $118,291 |
| Immigrants | Lithuania | 100.0 /100 | #40 | Exceptional $118,053 |
| Estonians | 100.0 /100 | #41 | Exceptional $118,013 |
| Immigrants | Bolivia | 100.0 /100 | #42 | Exceptional $117,912 |
| Bulgarians | 100.0 /100 | #43 | Exceptional $117,818 |
| Cambodians | 100.0 /100 | #44 | Exceptional $117,780 |
| Immigrants | Greece | 99.9 /100 | #45 | Exceptional $117,344 |
| Immigrants | Russia | 99.9 /100 | #46 | Exceptional $116,942 |
| Immigrants | Austria | 99.9 /100 | #47 | Exceptional $116,830 |
| Immigrants | South Africa | 99.9 /100 | #48 | Exceptional $116,286 |
Demographics Similar to Lumbee by Median Family Income
In terms of median family income, the demographic groups most similar to Lumbee are Puerto Rican ($70,423, a difference of 2.5%), Navajo ($70,989, a difference of 3.4%), Tohono O'odham ($72,193, a difference of 5.1%), Houma ($76,188, a difference of 10.9%), and Crow ($76,605, a difference of 11.5%).
| Demographics | Rating | Rank | Median Family Income |
| Kiowa | 0.0 /100 | #333 | Tragic $80,885 |
| Menominee | 0.0 /100 | #334 | Tragic $79,563 |
| Yup'ik | 0.0 /100 | #335 | Tragic $79,290 |
| Immigrants | Cuba | 0.0 /100 | #336 | Tragic $78,249 |
| Yuman | 0.0 /100 | #337 | Tragic $78,055 |
| Immigrants | Yemen | 0.0 /100 | #338 | Tragic $77,457 |
| Pima | 0.0 /100 | #339 | Tragic $77,431 |
| Hopi | 0.0 /100 | #340 | Tragic $77,188 |
| Pueblo | 0.0 /100 | #341 | Tragic $76,880 |
| Crow | 0.0 /100 | #342 | Tragic $76,605 |
| Houma | 0.0 /100 | #343 | Tragic $76,188 |
| Tohono O'odham | 0.0 /100 | #344 | Tragic $72,193 |
| Navajo | 0.0 /100 | #345 | Tragic $70,989 |
| Puerto Ricans | 0.0 /100 | #346 | Tragic $70,423 |
| Lumbee | 0.0 /100 | #347 | Tragic $68,679 |