Cheyenne vs Lumbee Median Family Income
COMPARE
Cheyenne
Lumbee
Median Family Income
Median Family Income Comparison
Cheyenne
Lumbee
$81,385
MEDIAN FAMILY INCOME
0.0/ 100
METRIC RATING
330th/ 347
METRIC RANK
$68,679
MEDIAN FAMILY INCOME
0.0/ 100
METRIC RATING
347th/ 347
METRIC RANK
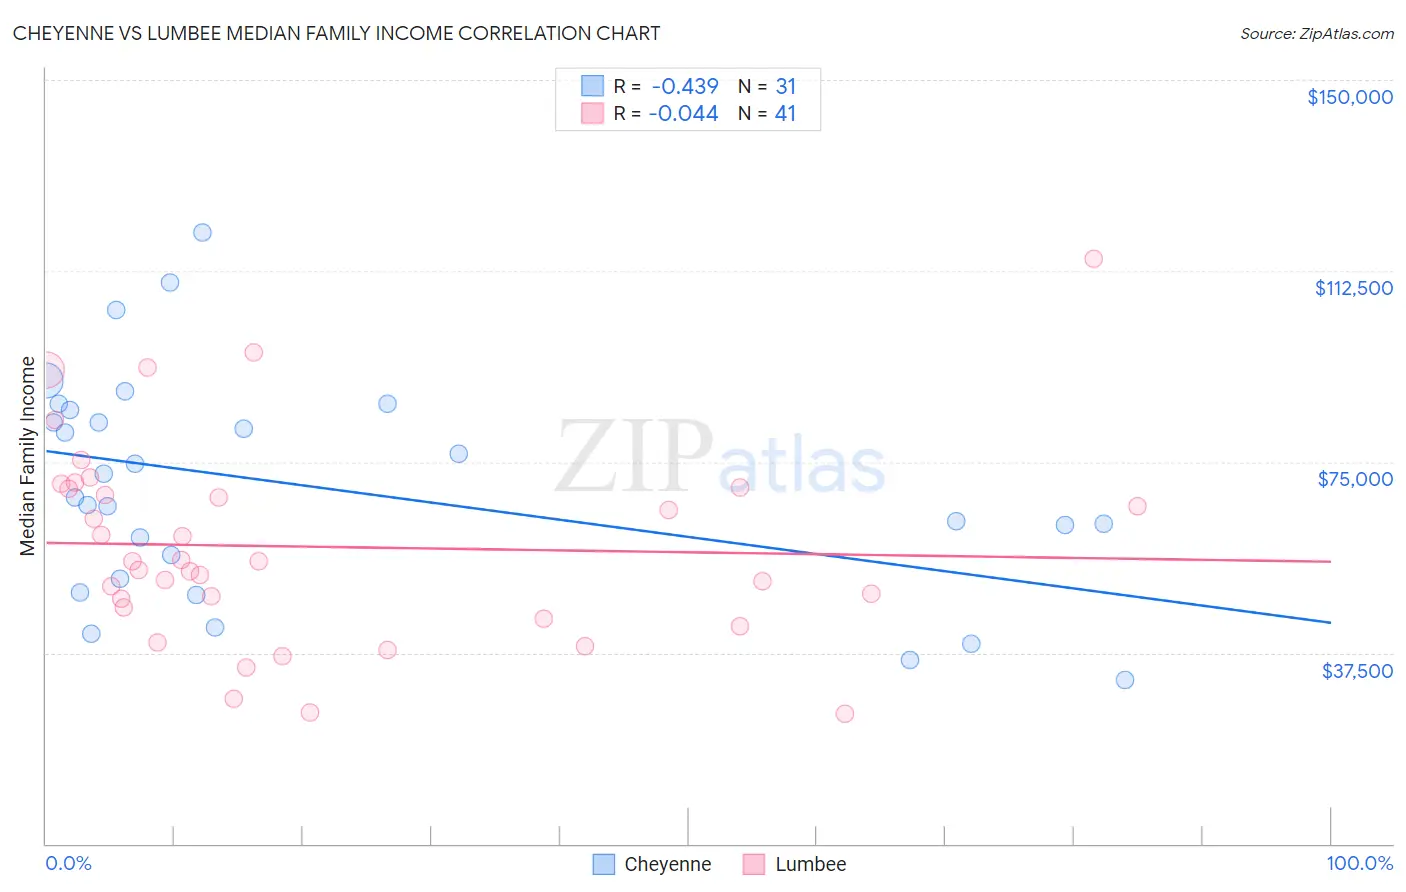
Cheyenne vs Lumbee Median Family Income Correlation Chart
The statistical analysis conducted on geographies consisting of 80,698,521 people shows a moderate negative correlation between the proportion of Cheyenne and median family income in the United States with a correlation coefficient (R) of -0.439 and weighted average of $81,385. Similarly, the statistical analysis conducted on geographies consisting of 92,247,043 people shows no correlation between the proportion of Lumbee and median family income in the United States with a correlation coefficient (R) of -0.044 and weighted average of $68,679, a difference of 18.5%.
Median Family Income Correlation Summary
| Measurement | Cheyenne | Lumbee |
| Minimum | $32,159 | $25,481 |
| Maximum | $120,128 | $114,792 |
| Range | $87,969 | $89,311 |
| Mean | $70,077 | $58,324 |
| Median | $67,927 | $55,406 |
| Interquartile 25% (IQ1) | $52,031 | $45,288 |
| Interquartile 75% (IQ3) | $85,161 | $69,902 |
| Interquartile Range (IQR) | $33,130 | $24,614 |
| Standard Deviation (Sample) | $21,843 | $19,662 |
| Standard Deviation (Population) | $21,488 | $19,420 |
Demographics Similar to Cheyenne and Lumbee by Median Family Income
In terms of median family income, the demographic groups most similar to Cheyenne are Immigrants from Dominican Republic ($81,233, a difference of 0.19%), Dutch West Indian ($81,852, a difference of 0.57%), Native/Alaskan ($80,908, a difference of 0.59%), Kiowa ($80,885, a difference of 0.62%), and Black/African American ($81,912, a difference of 0.65%). Similarly, the demographic groups most similar to Lumbee are Puerto Rican ($70,423, a difference of 2.5%), Navajo ($70,989, a difference of 3.4%), Tohono O'odham ($72,193, a difference of 5.1%), Houma ($76,188, a difference of 10.9%), and Crow ($76,605, a difference of 11.5%).
| Demographics | Rating | Rank | Median Family Income |
| Blacks/African Americans | 0.0 /100 | #328 | Tragic $81,912 |
| Dutch West Indians | 0.0 /100 | #329 | Tragic $81,852 |
| Cheyenne | 0.0 /100 | #330 | Tragic $81,385 |
| Immigrants | Dominican Republic | 0.0 /100 | #331 | Tragic $81,233 |
| Natives/Alaskans | 0.0 /100 | #332 | Tragic $80,908 |
| Kiowa | 0.0 /100 | #333 | Tragic $80,885 |
| Menominee | 0.0 /100 | #334 | Tragic $79,563 |
| Yup'ik | 0.0 /100 | #335 | Tragic $79,290 |
| Immigrants | Cuba | 0.0 /100 | #336 | Tragic $78,249 |
| Yuman | 0.0 /100 | #337 | Tragic $78,055 |
| Immigrants | Yemen | 0.0 /100 | #338 | Tragic $77,457 |
| Pima | 0.0 /100 | #339 | Tragic $77,431 |
| Hopi | 0.0 /100 | #340 | Tragic $77,188 |
| Pueblo | 0.0 /100 | #341 | Tragic $76,880 |
| Crow | 0.0 /100 | #342 | Tragic $76,605 |
| Houma | 0.0 /100 | #343 | Tragic $76,188 |
| Tohono O'odham | 0.0 /100 | #344 | Tragic $72,193 |
| Navajo | 0.0 /100 | #345 | Tragic $70,989 |
| Puerto Ricans | 0.0 /100 | #346 | Tragic $70,423 |
| Lumbee | 0.0 /100 | #347 | Tragic $68,679 |