Vietnamese vs Lumbee Median Family Income
COMPARE
Vietnamese
Lumbee
Median Family Income
Median Family Income Comparison
Vietnamese
Lumbee
$96,123
MEDIAN FAMILY INCOME
3.4/ 100
METRIC RATING
225th/ 347
METRIC RANK
$68,679
MEDIAN FAMILY INCOME
0.0/ 100
METRIC RATING
347th/ 347
METRIC RANK
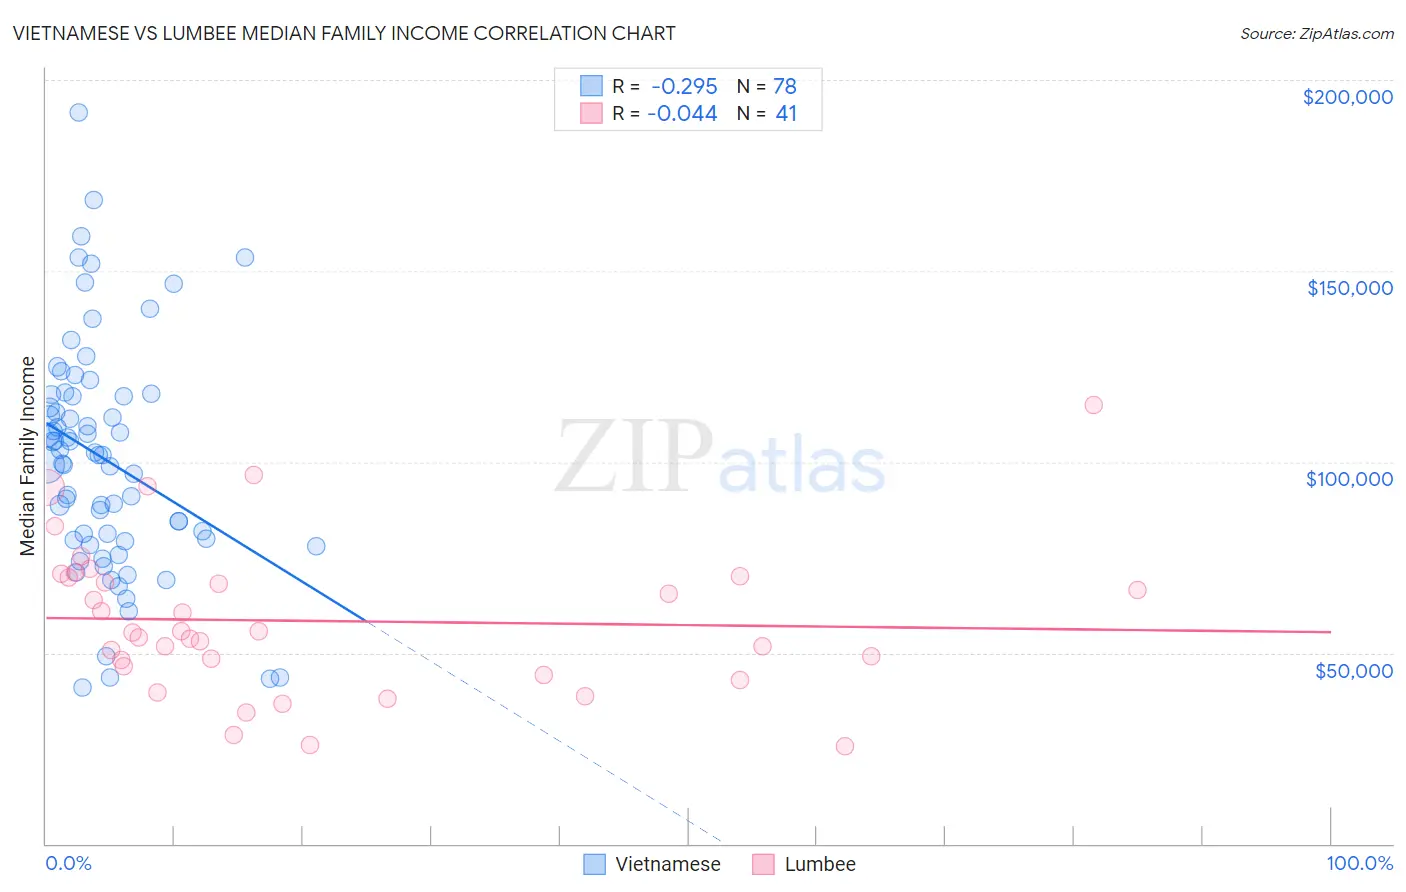
Vietnamese vs Lumbee Median Family Income Correlation Chart
The statistical analysis conducted on geographies consisting of 170,610,316 people shows a weak negative correlation between the proportion of Vietnamese and median family income in the United States with a correlation coefficient (R) of -0.295 and weighted average of $96,123. Similarly, the statistical analysis conducted on geographies consisting of 92,247,043 people shows no correlation between the proportion of Lumbee and median family income in the United States with a correlation coefficient (R) of -0.044 and weighted average of $68,679, a difference of 40.0%.
Median Family Income Correlation Summary
| Measurement | Vietnamese | Lumbee |
| Minimum | $40,807 | $25,481 |
| Maximum | $191,643 | $114,792 |
| Range | $150,837 | $89,311 |
| Mean | $100,636 | $58,324 |
| Median | $101,824 | $55,406 |
| Interquartile 25% (IQ1) | $79,608 | $45,288 |
| Interquartile 75% (IQ3) | $117,250 | $69,902 |
| Interquartile Range (IQR) | $37,642 | $24,614 |
| Standard Deviation (Sample) | $30,077 | $19,662 |
| Standard Deviation (Population) | $29,884 | $19,420 |
Similar Demographics by Median Family Income
Demographics Similar to Vietnamese by Median Family Income
In terms of median family income, the demographic groups most similar to Vietnamese are Nonimmigrants ($96,231, a difference of 0.11%), Venezuelan ($96,281, a difference of 0.16%), Immigrants from Nigeria ($96,439, a difference of 0.33%), Immigrants from Ghana ($96,544, a difference of 0.44%), and Immigrants from Panama ($95,647, a difference of 0.50%).
| Demographics | Rating | Rank | Median Family Income |
| Immigrants | Cambodia | 5.8 /100 | #218 | Tragic $97,222 |
| Delaware | 5.1 /100 | #219 | Tragic $96,958 |
| Sudanese | 4.7 /100 | #220 | Tragic $96,783 |
| Immigrants | Ghana | 4.2 /100 | #221 | Tragic $96,544 |
| Immigrants | Nigeria | 4.0 /100 | #222 | Tragic $96,439 |
| Venezuelans | 3.7 /100 | #223 | Tragic $96,281 |
| Immigrants | Nonimmigrants | 3.6 /100 | #224 | Tragic $96,231 |
| Vietnamese | 3.4 /100 | #225 | Tragic $96,123 |
| Immigrants | Panama | 2.7 /100 | #226 | Tragic $95,647 |
| Alaska Natives | 2.6 /100 | #227 | Tragic $95,573 |
| Immigrants | Azores | 2.4 /100 | #228 | Tragic $95,402 |
| Marshallese | 2.2 /100 | #229 | Tragic $95,293 |
| Malaysians | 2.2 /100 | #230 | Tragic $95,230 |
| Ecuadorians | 2.1 /100 | #231 | Tragic $95,114 |
| Immigrants | Venezuela | 1.9 /100 | #232 | Tragic $94,904 |
Demographics Similar to Lumbee by Median Family Income
In terms of median family income, the demographic groups most similar to Lumbee are Puerto Rican ($70,423, a difference of 2.5%), Navajo ($70,989, a difference of 3.4%), Tohono O'odham ($72,193, a difference of 5.1%), Houma ($76,188, a difference of 10.9%), and Crow ($76,605, a difference of 11.5%).
| Demographics | Rating | Rank | Median Family Income |
| Kiowa | 0.0 /100 | #333 | Tragic $80,885 |
| Menominee | 0.0 /100 | #334 | Tragic $79,563 |
| Yup'ik | 0.0 /100 | #335 | Tragic $79,290 |
| Immigrants | Cuba | 0.0 /100 | #336 | Tragic $78,249 |
| Yuman | 0.0 /100 | #337 | Tragic $78,055 |
| Immigrants | Yemen | 0.0 /100 | #338 | Tragic $77,457 |
| Pima | 0.0 /100 | #339 | Tragic $77,431 |
| Hopi | 0.0 /100 | #340 | Tragic $77,188 |
| Pueblo | 0.0 /100 | #341 | Tragic $76,880 |
| Crow | 0.0 /100 | #342 | Tragic $76,605 |
| Houma | 0.0 /100 | #343 | Tragic $76,188 |
| Tohono O'odham | 0.0 /100 | #344 | Tragic $72,193 |
| Navajo | 0.0 /100 | #345 | Tragic $70,989 |
| Puerto Ricans | 0.0 /100 | #346 | Tragic $70,423 |
| Lumbee | 0.0 /100 | #347 | Tragic $68,679 |