Maltese vs Immigrants from Lithuania Per Capita Income
COMPARE
Maltese
Immigrants from Lithuania
Per Capita Income
Per Capita Income Comparison
Maltese
Immigrants from Lithuania
$49,640
PER CAPITA INCOME
99.9/ 100
METRIC RATING
63rd/ 347
METRIC RANK
$51,361
PER CAPITA INCOME
100.0/ 100
METRIC RATING
43rd/ 347
METRIC RANK
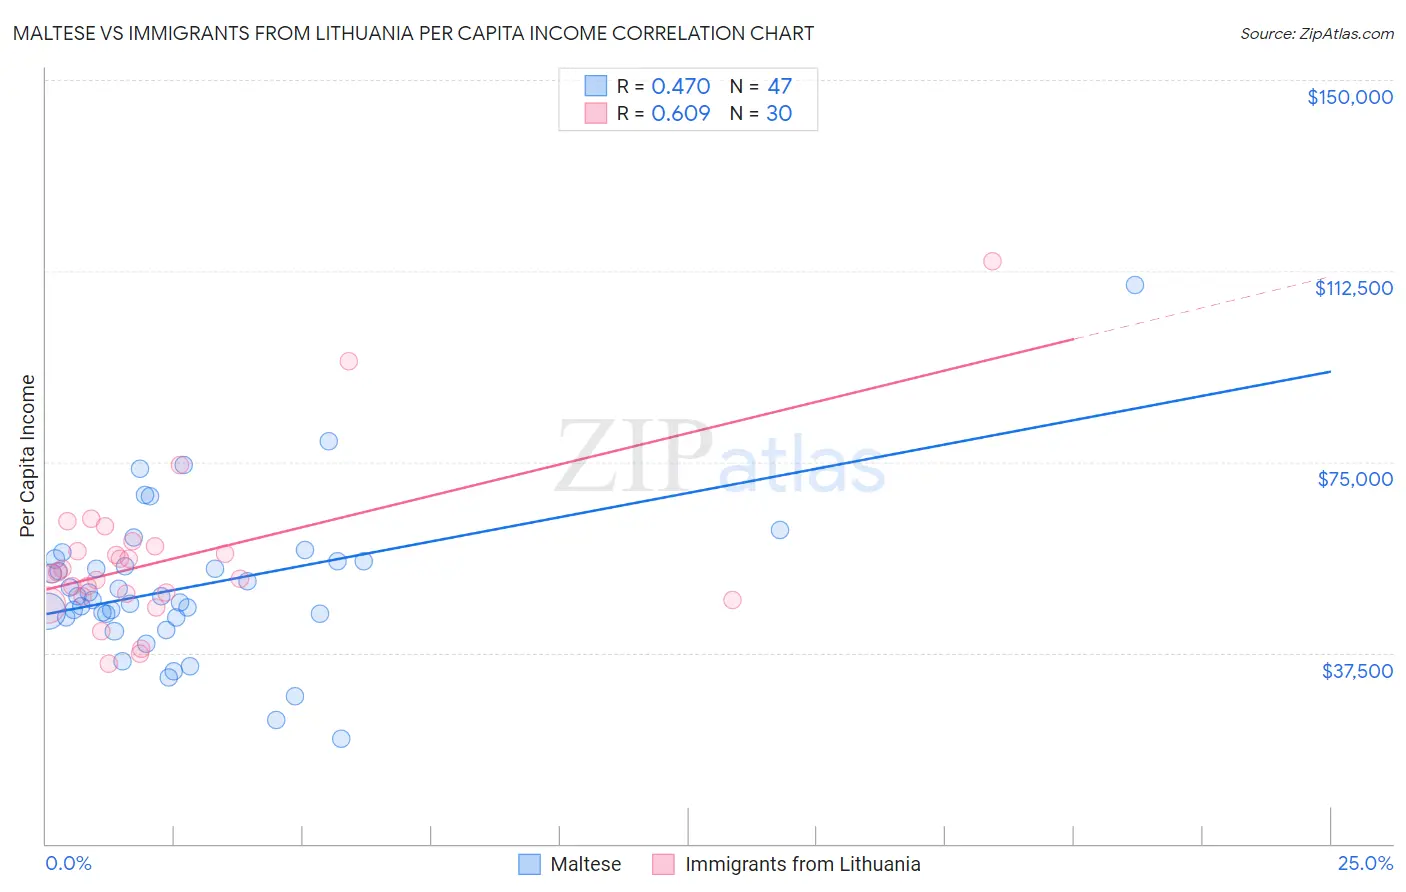
Maltese vs Immigrants from Lithuania Per Capita Income Correlation Chart
The statistical analysis conducted on geographies consisting of 126,316,532 people shows a moderate positive correlation between the proportion of Maltese and per capita income in the United States with a correlation coefficient (R) of 0.470 and weighted average of $49,640. Similarly, the statistical analysis conducted on geographies consisting of 117,724,932 people shows a significant positive correlation between the proportion of Immigrants from Lithuania and per capita income in the United States with a correlation coefficient (R) of 0.609 and weighted average of $51,361, a difference of 3.5%.
Per Capita Income Correlation Summary
| Measurement | Maltese | Immigrants from Lithuania |
| Minimum | $20,612 | $35,413 |
| Maximum | $109,686 | $114,327 |
| Range | $89,074 | $78,914 |
| Mean | $50,567 | $56,005 |
| Median | $48,495 | $53,196 |
| Interquartile 25% (IQ1) | $44,523 | $48,580 |
| Interquartile 75% (IQ3) | $55,569 | $58,433 |
| Interquartile Range (IQR) | $11,046 | $9,853 |
| Standard Deviation (Sample) | $14,877 | $15,760 |
| Standard Deviation (Population) | $14,718 | $15,495 |
Demographics Similar to Maltese and Immigrants from Lithuania by Per Capita Income
In terms of per capita income, the demographic groups most similar to Maltese are Immigrants from Asia ($49,741, a difference of 0.20%), Argentinean ($49,862, a difference of 0.45%), Bhutanese ($49,894, a difference of 0.51%), Immigrants from Scotland ($49,893, a difference of 0.51%), and Immigrants from Malaysia ($49,983, a difference of 0.69%). Similarly, the demographic groups most similar to Immigrants from Lithuania are Immigrants from Europe ($50,950, a difference of 0.81%), Immigrants from Spain ($50,933, a difference of 0.84%), Immigrants from Latvia ($50,914, a difference of 0.88%), Bulgarian ($50,906, a difference of 0.89%), and Immigrants from Serbia ($50,810, a difference of 1.1%).
| Demographics | Rating | Rank | Per Capita Income |
| Immigrants | Lithuania | 100.0 /100 | #43 | Exceptional $51,361 |
| Immigrants | Europe | 100.0 /100 | #44 | Exceptional $50,950 |
| Immigrants | Spain | 100.0 /100 | #45 | Exceptional $50,933 |
| Immigrants | Latvia | 100.0 /100 | #46 | Exceptional $50,914 |
| Bulgarians | 100.0 /100 | #47 | Exceptional $50,906 |
| Immigrants | Serbia | 100.0 /100 | #48 | Exceptional $50,810 |
| New Zealanders | 100.0 /100 | #49 | Exceptional $50,575 |
| Immigrants | Sri Lanka | 100.0 /100 | #50 | Exceptional $50,555 |
| Immigrants | Netherlands | 100.0 /100 | #51 | Exceptional $50,458 |
| Immigrants | Croatia | 99.9 /100 | #52 | Exceptional $50,417 |
| Paraguayans | 99.9 /100 | #53 | Exceptional $50,385 |
| Immigrants | Belarus | 99.9 /100 | #54 | Exceptional $50,303 |
| Immigrants | Western Europe | 99.9 /100 | #55 | Exceptional $50,065 |
| Asians | 99.9 /100 | #56 | Exceptional $50,057 |
| South Africans | 99.9 /100 | #57 | Exceptional $50,044 |
| Immigrants | Malaysia | 99.9 /100 | #58 | Exceptional $49,983 |
| Bhutanese | 99.9 /100 | #59 | Exceptional $49,894 |
| Immigrants | Scotland | 99.9 /100 | #60 | Exceptional $49,893 |
| Argentineans | 99.9 /100 | #61 | Exceptional $49,862 |
| Immigrants | Asia | 99.9 /100 | #62 | Exceptional $49,741 |
| Maltese | 99.9 /100 | #63 | Exceptional $49,640 |