Jamaican vs Immigrants from Pakistan Per Capita Income
COMPARE
Jamaican
Immigrants from Pakistan
Per Capita Income
Per Capita Income Comparison
Jamaicans
Immigrants from Pakistan
$39,231
PER CAPITA INCOME
0.7/ 100
METRIC RATING
258th/ 347
METRIC RANK
$47,084
PER CAPITA INCOME
97.9/ 100
METRIC RATING
98th/ 347
METRIC RANK
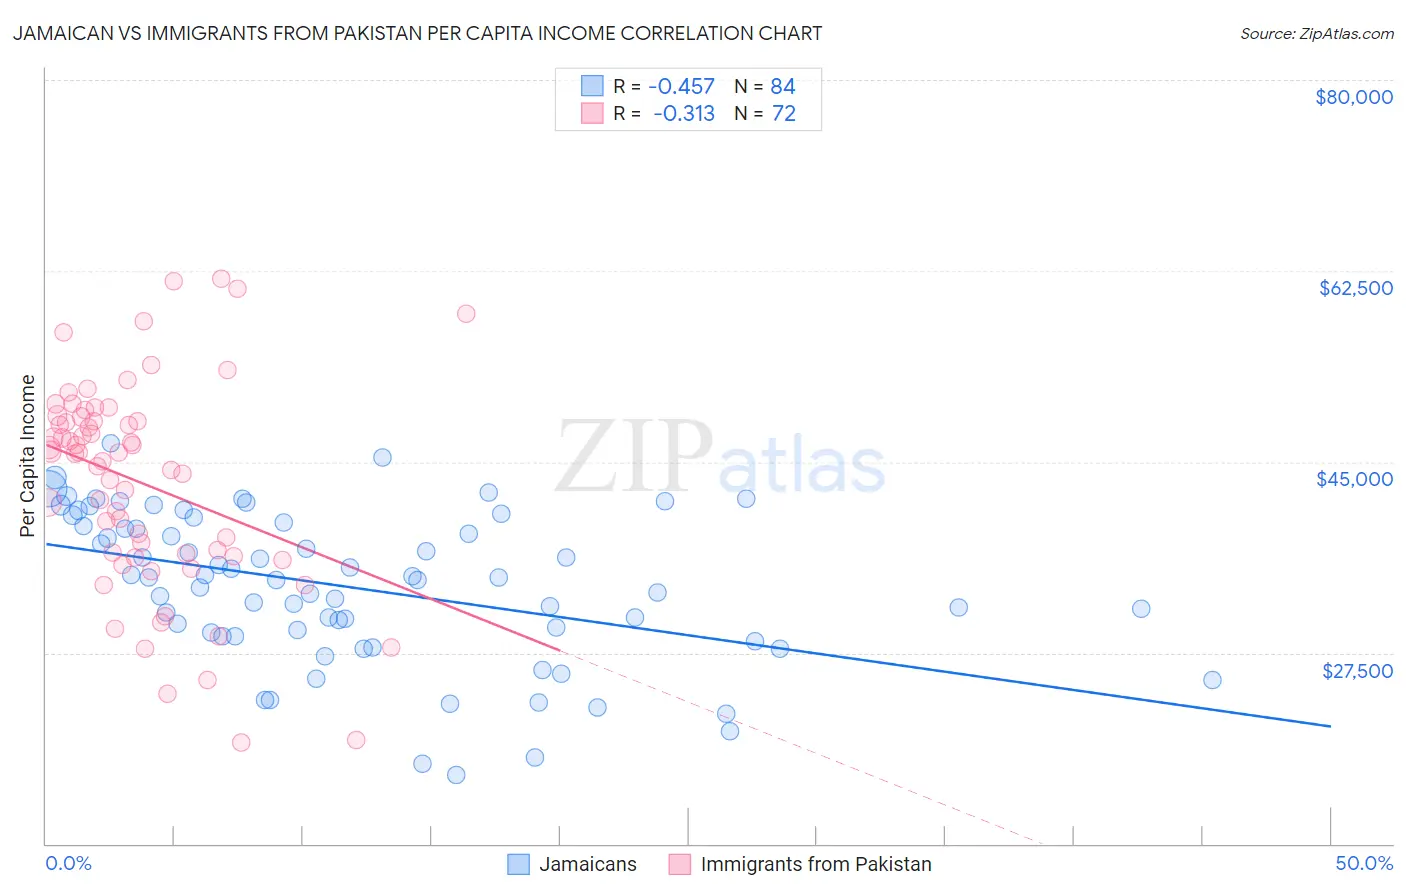
Jamaican vs Immigrants from Pakistan Per Capita Income Correlation Chart
The statistical analysis conducted on geographies consisting of 368,110,686 people shows a moderate negative correlation between the proportion of Jamaicans and per capita income in the United States with a correlation coefficient (R) of -0.457 and weighted average of $39,231. Similarly, the statistical analysis conducted on geographies consisting of 283,918,020 people shows a mild negative correlation between the proportion of Immigrants from Pakistan and per capita income in the United States with a correlation coefficient (R) of -0.313 and weighted average of $47,084, a difference of 20.0%.
Per Capita Income Correlation Summary
| Measurement | Jamaican | Immigrants from Pakistan |
| Minimum | $16,350 | $19,245 |
| Maximum | $46,707 | $61,776 |
| Range | $30,357 | $42,531 |
| Mean | $33,502 | $43,079 |
| Median | $34,287 | $45,819 |
| Interquartile 25% (IQ1) | $29,169 | $36,516 |
| Interquartile 75% (IQ3) | $39,281 | $48,924 |
| Interquartile Range (IQR) | $10,112 | $12,409 |
| Standard Deviation (Sample) | $6,895 | $9,561 |
| Standard Deviation (Population) | $6,854 | $9,495 |
Similar Demographics by Per Capita Income
Demographics Similar to Jamaicans by Per Capita Income
In terms of per capita income, the demographic groups most similar to Jamaicans are Malaysian ($39,194, a difference of 0.090%), Alaskan Athabascan ($39,163, a difference of 0.17%), Marshallese ($39,108, a difference of 0.31%), Iroquois ($39,104, a difference of 0.33%), and Belizean ($39,097, a difference of 0.34%).
| Demographics | Rating | Rank | Per Capita Income |
| Samoans | 1.3 /100 | #251 | Tragic $39,826 |
| Immigrants | Azores | 1.0 /100 | #252 | Tragic $39,608 |
| Osage | 1.0 /100 | #253 | Tragic $39,568 |
| Alaska Natives | 1.0 /100 | #254 | Tragic $39,558 |
| Immigrants | Middle Africa | 1.0 /100 | #255 | Tragic $39,529 |
| Hawaiians | 0.8 /100 | #256 | Tragic $39,403 |
| Nicaraguans | 0.8 /100 | #257 | Tragic $39,372 |
| Jamaicans | 0.7 /100 | #258 | Tragic $39,231 |
| Malaysians | 0.7 /100 | #259 | Tragic $39,194 |
| Alaskan Athabascans | 0.6 /100 | #260 | Tragic $39,163 |
| Marshallese | 0.6 /100 | #261 | Tragic $39,108 |
| Iroquois | 0.6 /100 | #262 | Tragic $39,104 |
| Belizeans | 0.6 /100 | #263 | Tragic $39,097 |
| Americans | 0.6 /100 | #264 | Tragic $39,039 |
| Spanish Americans | 0.5 /100 | #265 | Tragic $39,012 |
Demographics Similar to Immigrants from Pakistan by Per Capita Income
In terms of per capita income, the demographic groups most similar to Immigrants from Pakistan are Laotian ($47,041, a difference of 0.090%), Immigrants from Lebanon ($46,938, a difference of 0.31%), Immigrants from Uzbekistan ($46,929, a difference of 0.33%), Carpatho Rusyn ($47,248, a difference of 0.35%), and Alsatian ($47,284, a difference of 0.43%).
| Demographics | Rating | Rank | Per Capita Income |
| Macedonians | 98.8 /100 | #91 | Exceptional $47,573 |
| Immigrants | Moldova | 98.7 /100 | #92 | Exceptional $47,489 |
| Immigrants | Zimbabwe | 98.5 /100 | #93 | Exceptional $47,394 |
| Albanians | 98.5 /100 | #94 | Exceptional $47,379 |
| Immigrants | Egypt | 98.5 /100 | #95 | Exceptional $47,361 |
| Alsatians | 98.3 /100 | #96 | Exceptional $47,284 |
| Carpatho Rusyns | 98.2 /100 | #97 | Exceptional $47,248 |
| Immigrants | Pakistan | 97.9 /100 | #98 | Exceptional $47,084 |
| Laotians | 97.8 /100 | #99 | Exceptional $47,041 |
| Immigrants | Lebanon | 97.5 /100 | #100 | Exceptional $46,938 |
| Immigrants | Uzbekistan | 97.5 /100 | #101 | Exceptional $46,929 |
| Immigrants | Western Asia | 97.4 /100 | #102 | Exceptional $46,876 |
| Syrians | 97.2 /100 | #103 | Exceptional $46,837 |
| Brazilians | 96.8 /100 | #104 | Exceptional $46,700 |
| British | 96.3 /100 | #105 | Exceptional $46,571 |