Jamaican vs Immigrants from Peru Per Capita Income
COMPARE
Jamaican
Immigrants from Peru
Per Capita Income
Per Capita Income Comparison
Jamaicans
Immigrants from Peru
$39,231
PER CAPITA INCOME
0.7/ 100
METRIC RATING
258th/ 347
METRIC RANK
$43,852
PER CAPITA INCOME
55.3/ 100
METRIC RATING
169th/ 347
METRIC RANK
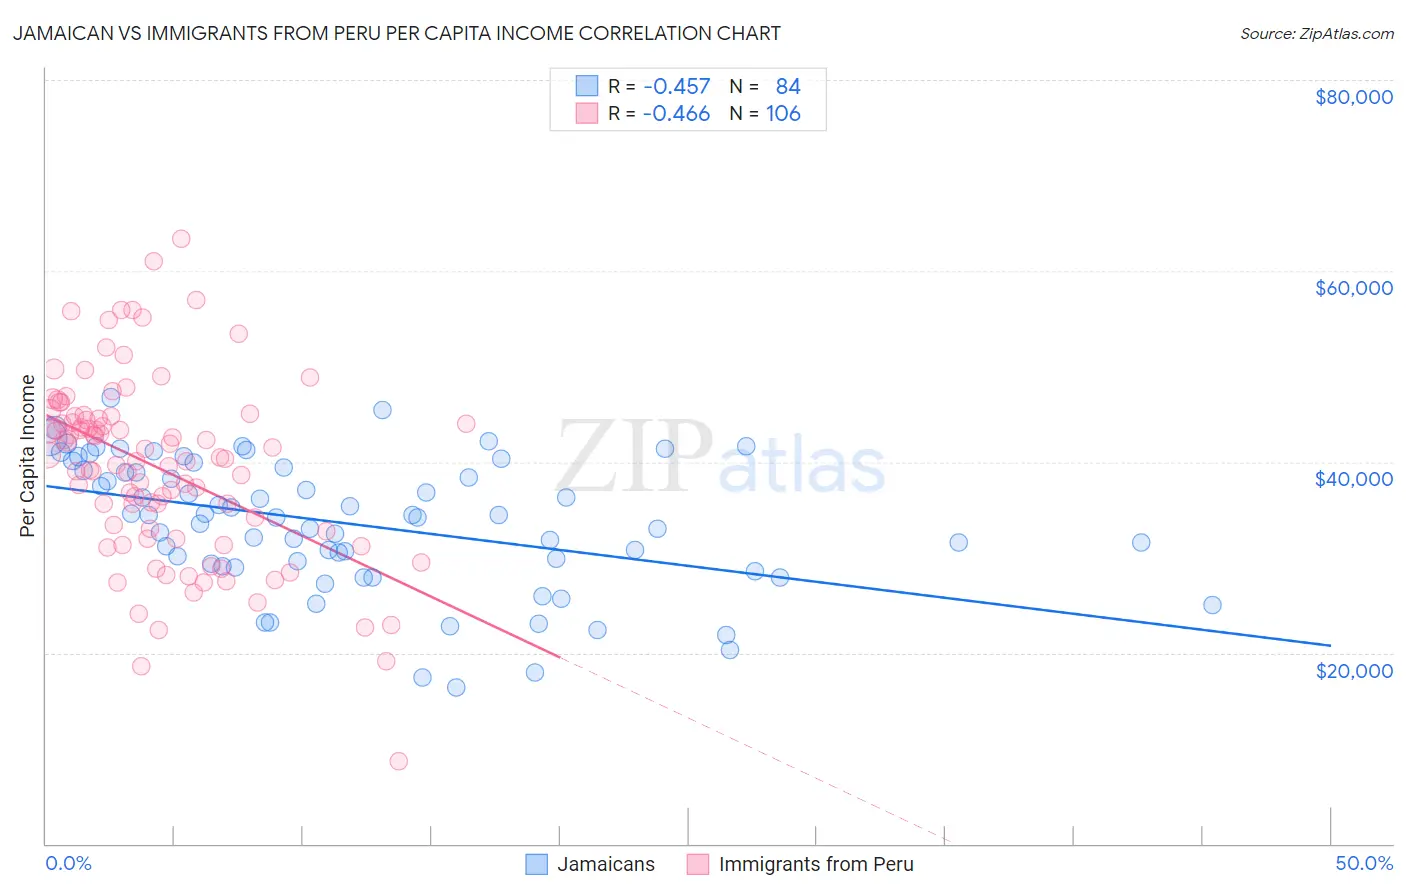
Jamaican vs Immigrants from Peru Per Capita Income Correlation Chart
The statistical analysis conducted on geographies consisting of 368,110,686 people shows a moderate negative correlation between the proportion of Jamaicans and per capita income in the United States with a correlation coefficient (R) of -0.457 and weighted average of $39,231. Similarly, the statistical analysis conducted on geographies consisting of 328,865,889 people shows a moderate negative correlation between the proportion of Immigrants from Peru and per capita income in the United States with a correlation coefficient (R) of -0.466 and weighted average of $43,852, a difference of 11.8%.
Per Capita Income Correlation Summary
| Measurement | Jamaican | Immigrants from Peru |
| Minimum | $16,350 | $8,682 |
| Maximum | $46,707 | $63,347 |
| Range | $30,357 | $54,665 |
| Mean | $33,502 | $39,361 |
| Median | $34,287 | $40,406 |
| Interquartile 25% (IQ1) | $29,169 | $32,749 |
| Interquartile 75% (IQ3) | $39,281 | $44,764 |
| Interquartile Range (IQR) | $10,112 | $12,015 |
| Standard Deviation (Sample) | $6,895 | $9,599 |
| Standard Deviation (Population) | $6,854 | $9,553 |
Similar Demographics by Per Capita Income
Demographics Similar to Jamaicans by Per Capita Income
In terms of per capita income, the demographic groups most similar to Jamaicans are Malaysian ($39,194, a difference of 0.090%), Alaskan Athabascan ($39,163, a difference of 0.17%), Marshallese ($39,108, a difference of 0.31%), Iroquois ($39,104, a difference of 0.33%), and Belizean ($39,097, a difference of 0.34%).
| Demographics | Rating | Rank | Per Capita Income |
| Samoans | 1.3 /100 | #251 | Tragic $39,826 |
| Immigrants | Azores | 1.0 /100 | #252 | Tragic $39,608 |
| Osage | 1.0 /100 | #253 | Tragic $39,568 |
| Alaska Natives | 1.0 /100 | #254 | Tragic $39,558 |
| Immigrants | Middle Africa | 1.0 /100 | #255 | Tragic $39,529 |
| Hawaiians | 0.8 /100 | #256 | Tragic $39,403 |
| Nicaraguans | 0.8 /100 | #257 | Tragic $39,372 |
| Jamaicans | 0.7 /100 | #258 | Tragic $39,231 |
| Malaysians | 0.7 /100 | #259 | Tragic $39,194 |
| Alaskan Athabascans | 0.6 /100 | #260 | Tragic $39,163 |
| Marshallese | 0.6 /100 | #261 | Tragic $39,108 |
| Iroquois | 0.6 /100 | #262 | Tragic $39,104 |
| Belizeans | 0.6 /100 | #263 | Tragic $39,097 |
| Americans | 0.6 /100 | #264 | Tragic $39,039 |
| Spanish Americans | 0.5 /100 | #265 | Tragic $39,012 |
Demographics Similar to Immigrants from Peru by Per Capita Income
In terms of per capita income, the demographic groups most similar to Immigrants from Peru are Scandinavian ($43,848, a difference of 0.010%), Immigrants from Eastern Africa ($43,838, a difference of 0.030%), Czechoslovakian ($43,806, a difference of 0.11%), Belgian ($43,951, a difference of 0.23%), and English ($43,982, a difference of 0.30%).
| Demographics | Rating | Rank | Per Capita Income |
| Swiss | 61.4 /100 | #162 | Good $44,076 |
| Immigrants | South America | 61.2 /100 | #163 | Good $44,068 |
| Sri Lankans | 59.8 /100 | #164 | Average $44,014 |
| Immigrants | Philippines | 59.4 /100 | #165 | Average $44,000 |
| Immigrants | Uruguay | 59.3 /100 | #166 | Average $43,997 |
| English | 58.9 /100 | #167 | Average $43,982 |
| Belgians | 58.1 /100 | #168 | Average $43,951 |
| Immigrants | Peru | 55.3 /100 | #169 | Average $43,852 |
| Scandinavians | 55.2 /100 | #170 | Average $43,848 |
| Immigrants | Eastern Africa | 54.9 /100 | #171 | Average $43,838 |
| Czechoslovakians | 54.1 /100 | #172 | Average $43,806 |
| French | 50.7 /100 | #173 | Average $43,685 |
| Colombians | 50.0 /100 | #174 | Average $43,661 |
| Celtics | 48.9 /100 | #175 | Average $43,621 |
| Immigrants | South Eastern Asia | 46.6 /100 | #176 | Average $43,539 |