Jamaican vs Immigrants from Syria Per Capita Income
COMPARE
Jamaican
Immigrants from Syria
Per Capita Income
Per Capita Income Comparison
Jamaicans
Immigrants from Syria
$39,231
PER CAPITA INCOME
0.7/ 100
METRIC RATING
258th/ 347
METRIC RANK
$45,218
PER CAPITA INCOME
85.2/ 100
METRIC RATING
137th/ 347
METRIC RANK
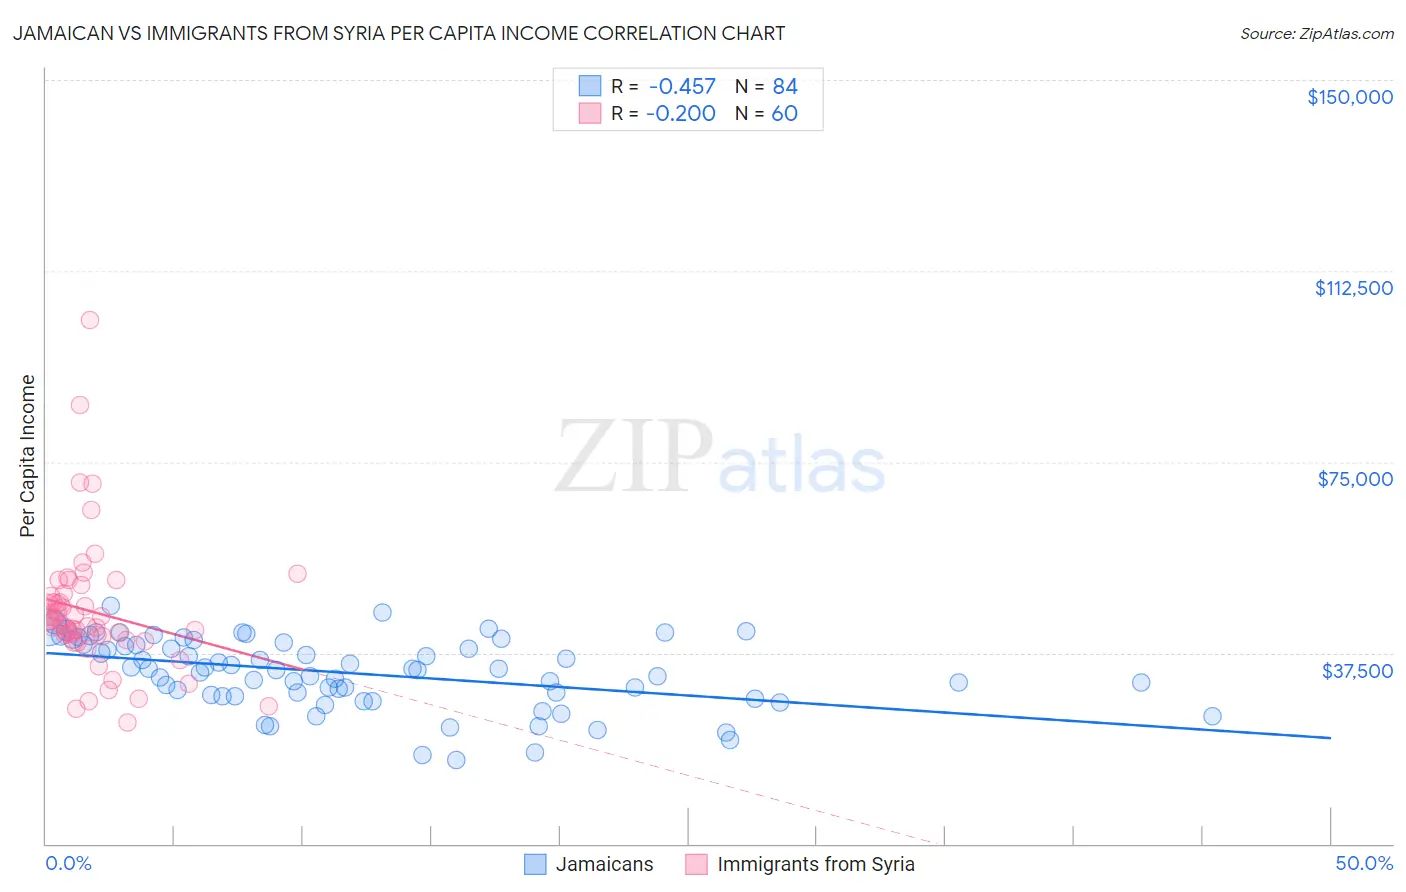
Jamaican vs Immigrants from Syria Per Capita Income Correlation Chart
The statistical analysis conducted on geographies consisting of 368,110,686 people shows a moderate negative correlation between the proportion of Jamaicans and per capita income in the United States with a correlation coefficient (R) of -0.457 and weighted average of $39,231. Similarly, the statistical analysis conducted on geographies consisting of 174,111,110 people shows a poor negative correlation between the proportion of Immigrants from Syria and per capita income in the United States with a correlation coefficient (R) of -0.200 and weighted average of $45,218, a difference of 15.3%.
Per Capita Income Correlation Summary
| Measurement | Jamaican | Immigrants from Syria |
| Minimum | $16,350 | $23,901 |
| Maximum | $46,707 | $102,814 |
| Range | $30,357 | $78,913 |
| Mean | $33,502 | $45,572 |
| Median | $34,287 | $43,422 |
| Interquartile 25% (IQ1) | $29,169 | $40,433 |
| Interquartile 75% (IQ3) | $39,281 | $48,863 |
| Interquartile Range (IQR) | $10,112 | $8,430 |
| Standard Deviation (Sample) | $6,895 | $13,127 |
| Standard Deviation (Population) | $6,854 | $13,017 |
Similar Demographics by Per Capita Income
Demographics Similar to Jamaicans by Per Capita Income
In terms of per capita income, the demographic groups most similar to Jamaicans are Malaysian ($39,194, a difference of 0.090%), Alaskan Athabascan ($39,163, a difference of 0.17%), Marshallese ($39,108, a difference of 0.31%), Iroquois ($39,104, a difference of 0.33%), and Belizean ($39,097, a difference of 0.34%).
| Demographics | Rating | Rank | Per Capita Income |
| Samoans | 1.3 /100 | #251 | Tragic $39,826 |
| Immigrants | Azores | 1.0 /100 | #252 | Tragic $39,608 |
| Osage | 1.0 /100 | #253 | Tragic $39,568 |
| Alaska Natives | 1.0 /100 | #254 | Tragic $39,558 |
| Immigrants | Middle Africa | 1.0 /100 | #255 | Tragic $39,529 |
| Hawaiians | 0.8 /100 | #256 | Tragic $39,403 |
| Nicaraguans | 0.8 /100 | #257 | Tragic $39,372 |
| Jamaicans | 0.7 /100 | #258 | Tragic $39,231 |
| Malaysians | 0.7 /100 | #259 | Tragic $39,194 |
| Alaskan Athabascans | 0.6 /100 | #260 | Tragic $39,163 |
| Marshallese | 0.6 /100 | #261 | Tragic $39,108 |
| Iroquois | 0.6 /100 | #262 | Tragic $39,104 |
| Belizeans | 0.6 /100 | #263 | Tragic $39,097 |
| Americans | 0.6 /100 | #264 | Tragic $39,039 |
| Spanish Americans | 0.5 /100 | #265 | Tragic $39,012 |
Demographics Similar to Immigrants from Syria by Per Capita Income
In terms of per capita income, the demographic groups most similar to Immigrants from Syria are Immigrants from Oceania ($45,220, a difference of 0.0%), Assyrian/Chaldean/Syriac ($45,195, a difference of 0.050%), Basque ($45,086, a difference of 0.29%), Immigrants from Jordan ($45,066, a difference of 0.34%), and Slavic ($45,049, a difference of 0.38%).
| Demographics | Rating | Rank | Per Capita Income |
| Arabs | 90.4 /100 | #130 | Exceptional $45,662 |
| Immigrants | North Macedonia | 90.0 /100 | #131 | Exceptional $45,622 |
| Jordanians | 89.9 /100 | #132 | Excellent $45,605 |
| Pakistanis | 89.7 /100 | #133 | Excellent $45,587 |
| Slovenes | 89.6 /100 | #134 | Excellent $45,581 |
| Hungarians | 87.9 /100 | #135 | Excellent $45,426 |
| Immigrants | Oceania | 85.2 /100 | #136 | Excellent $45,220 |
| Immigrants | Syria | 85.2 /100 | #137 | Excellent $45,218 |
| Assyrians/Chaldeans/Syriacs | 84.8 /100 | #138 | Excellent $45,195 |
| Basques | 83.2 /100 | #139 | Excellent $45,086 |
| Immigrants | Jordan | 82.9 /100 | #140 | Excellent $45,066 |
| Slavs | 82.6 /100 | #141 | Excellent $45,049 |
| Ugandans | 82.6 /100 | #142 | Excellent $45,047 |
| Immigrants | Uganda | 82.5 /100 | #143 | Excellent $45,043 |
| Icelanders | 81.6 /100 | #144 | Excellent $44,987 |