Navajo vs Immigrants from Lithuania Per Capita Income
COMPARE
Navajo
Immigrants from Lithuania
Per Capita Income
Per Capita Income Comparison
Navajo
Immigrants from Lithuania
$29,031
PER CAPITA INCOME
0.0/ 100
METRIC RATING
347th/ 347
METRIC RANK
$51,361
PER CAPITA INCOME
100.0/ 100
METRIC RATING
43rd/ 347
METRIC RANK
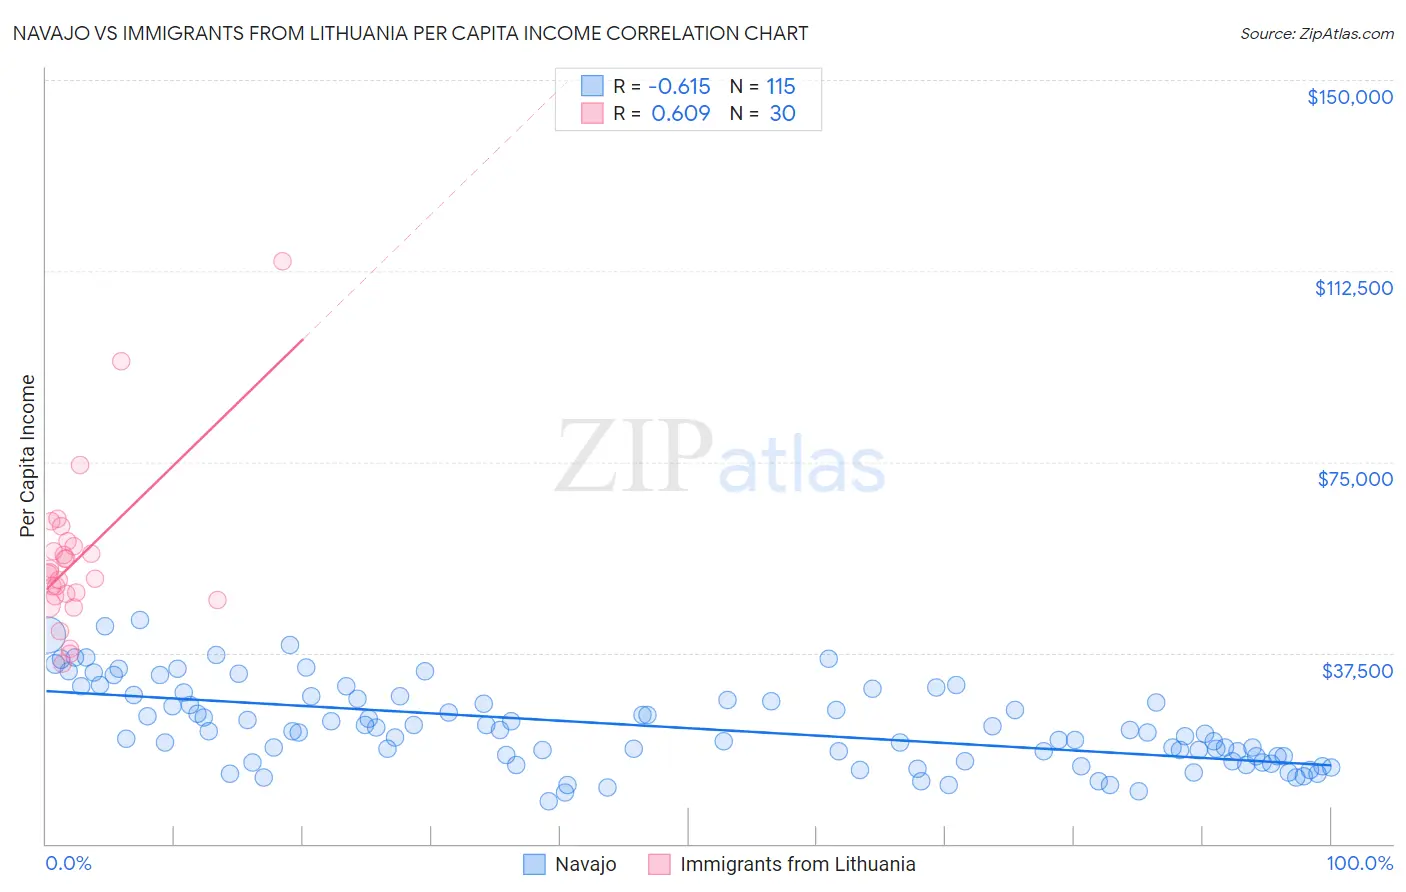
Navajo vs Immigrants from Lithuania Per Capita Income Correlation Chart
The statistical analysis conducted on geographies consisting of 224,872,448 people shows a significant negative correlation between the proportion of Navajo and per capita income in the United States with a correlation coefficient (R) of -0.615 and weighted average of $29,031. Similarly, the statistical analysis conducted on geographies consisting of 117,724,932 people shows a significant positive correlation between the proportion of Immigrants from Lithuania and per capita income in the United States with a correlation coefficient (R) of 0.609 and weighted average of $51,361, a difference of 76.9%.
Per Capita Income Correlation Summary
| Measurement | Navajo | Immigrants from Lithuania |
| Minimum | $8,247 | $35,413 |
| Maximum | $43,851 | $114,327 |
| Range | $35,604 | $78,914 |
| Mean | $22,991 | $56,005 |
| Median | $21,965 | $53,196 |
| Interquartile 25% (IQ1) | $16,235 | $48,580 |
| Interquartile 75% (IQ3) | $28,907 | $58,433 |
| Interquartile Range (IQR) | $12,672 | $9,853 |
| Standard Deviation (Sample) | $8,079 | $15,760 |
| Standard Deviation (Population) | $8,043 | $15,495 |
Similar Demographics by Per Capita Income
Demographics Similar to Navajo by Per Capita Income
In terms of per capita income, the demographic groups most similar to Navajo are Lumbee ($29,845, a difference of 2.8%), Tohono O'odham ($30,256, a difference of 4.2%), Yup'ik ($30,518, a difference of 5.1%), Pima ($30,644, a difference of 5.6%), and Hopi ($31,177, a difference of 7.4%).
| Demographics | Rating | Rank | Per Capita Income |
| Immigrants | Yemen | 0.0 /100 | #333 | Tragic $33,696 |
| Natives/Alaskans | 0.0 /100 | #334 | Tragic $33,279 |
| Yuman | 0.0 /100 | #335 | Tragic $33,236 |
| Yakama | 0.0 /100 | #336 | Tragic $33,009 |
| Houma | 0.0 /100 | #337 | Tragic $32,996 |
| Arapaho | 0.0 /100 | #338 | Tragic $32,345 |
| Pueblo | 0.0 /100 | #339 | Tragic $32,012 |
| Crow | 0.0 /100 | #340 | Tragic $31,729 |
| Puerto Ricans | 0.0 /100 | #341 | Tragic $31,268 |
| Hopi | 0.0 /100 | #342 | Tragic $31,177 |
| Pima | 0.0 /100 | #343 | Tragic $30,644 |
| Yup'ik | 0.0 /100 | #344 | Tragic $30,518 |
| Tohono O'odham | 0.0 /100 | #345 | Tragic $30,256 |
| Lumbee | 0.0 /100 | #346 | Tragic $29,845 |
| Navajo | 0.0 /100 | #347 | Tragic $29,031 |
Demographics Similar to Immigrants from Lithuania by Per Capita Income
In terms of per capita income, the demographic groups most similar to Immigrants from Lithuania are Immigrants from Turkey ($51,368, a difference of 0.010%), Immigrants from South Africa ($51,465, a difference of 0.20%), Immigrants from Korea ($51,671, a difference of 0.60%), Cambodian ($51,731, a difference of 0.72%), and Immigrants from Czechoslovakia ($51,770, a difference of 0.80%).
| Demographics | Rating | Rank | Per Capita Income |
| Immigrants | Greece | 100.0 /100 | #36 | Exceptional $51,891 |
| Estonians | 100.0 /100 | #37 | Exceptional $51,875 |
| Immigrants | Czechoslovakia | 100.0 /100 | #38 | Exceptional $51,770 |
| Cambodians | 100.0 /100 | #39 | Exceptional $51,731 |
| Immigrants | Korea | 100.0 /100 | #40 | Exceptional $51,671 |
| Immigrants | South Africa | 100.0 /100 | #41 | Exceptional $51,465 |
| Immigrants | Turkey | 100.0 /100 | #42 | Exceptional $51,368 |
| Immigrants | Lithuania | 100.0 /100 | #43 | Exceptional $51,361 |
| Immigrants | Europe | 100.0 /100 | #44 | Exceptional $50,950 |
| Immigrants | Spain | 100.0 /100 | #45 | Exceptional $50,933 |
| Immigrants | Latvia | 100.0 /100 | #46 | Exceptional $50,914 |
| Bulgarians | 100.0 /100 | #47 | Exceptional $50,906 |
| Immigrants | Serbia | 100.0 /100 | #48 | Exceptional $50,810 |
| New Zealanders | 100.0 /100 | #49 | Exceptional $50,575 |
| Immigrants | Sri Lanka | 100.0 /100 | #50 | Exceptional $50,555 |