Costa Rican vs Immigrants from Lithuania Per Capita Income
COMPARE
Costa Rican
Immigrants from Lithuania
Per Capita Income
Per Capita Income Comparison
Costa Ricans
Immigrants from Lithuania
$44,090
PER CAPITA INCOME
61.8/ 100
METRIC RATING
161st/ 347
METRIC RANK
$51,361
PER CAPITA INCOME
100.0/ 100
METRIC RATING
43rd/ 347
METRIC RANK
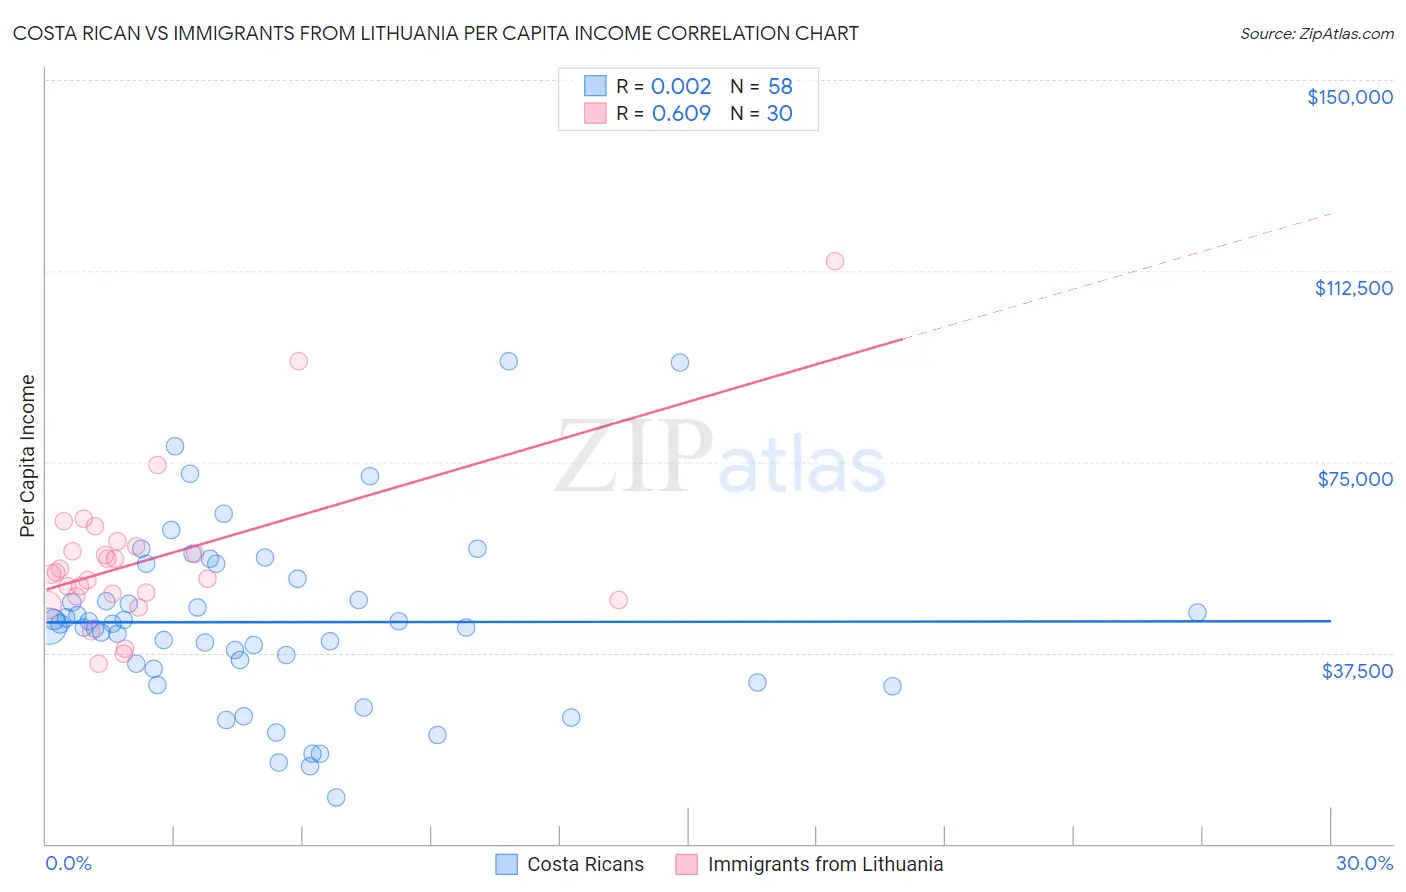
Costa Rican vs Immigrants from Lithuania Per Capita Income Correlation Chart
The statistical analysis conducted on geographies consisting of 253,595,957 people shows no correlation between the proportion of Costa Ricans and per capita income in the United States with a correlation coefficient (R) of 0.002 and weighted average of $44,090. Similarly, the statistical analysis conducted on geographies consisting of 117,724,932 people shows a significant positive correlation between the proportion of Immigrants from Lithuania and per capita income in the United States with a correlation coefficient (R) of 0.609 and weighted average of $51,361, a difference of 16.5%.
Per Capita Income Correlation Summary
| Measurement | Costa Rican | Immigrants from Lithuania |
| Minimum | $9,066 | $35,413 |
| Maximum | $94,709 | $114,327 |
| Range | $85,643 | $78,914 |
| Mean | $43,514 | $56,005 |
| Median | $42,885 | $53,196 |
| Interquartile 25% (IQ1) | $34,433 | $48,580 |
| Interquartile 75% (IQ3) | $52,139 | $58,433 |
| Interquartile Range (IQR) | $17,706 | $9,853 |
| Standard Deviation (Sample) | $17,472 | $15,760 |
| Standard Deviation (Population) | $17,321 | $15,495 |
Similar Demographics by Per Capita Income
Demographics Similar to Costa Ricans by Per Capita Income
In terms of per capita income, the demographic groups most similar to Costa Ricans are Danish ($44,095, a difference of 0.010%), Swiss ($44,076, a difference of 0.030%), South American ($44,114, a difference of 0.050%), Immigrants from South America ($44,068, a difference of 0.050%), and Sri Lankan ($44,014, a difference of 0.17%).
| Demographics | Rating | Rank | Per Capita Income |
| Portuguese | 68.7 /100 | #154 | Good $44,362 |
| Uruguayans | 67.6 /100 | #155 | Good $44,318 |
| Slovaks | 65.4 /100 | #156 | Good $44,229 |
| South American Indians | 64.8 /100 | #157 | Good $44,206 |
| Immigrants | Nepal | 64.3 /100 | #158 | Good $44,187 |
| South Americans | 62.4 /100 | #159 | Good $44,114 |
| Danes | 61.9 /100 | #160 | Good $44,095 |
| Costa Ricans | 61.8 /100 | #161 | Good $44,090 |
| Swiss | 61.4 /100 | #162 | Good $44,076 |
| Immigrants | South America | 61.2 /100 | #163 | Good $44,068 |
| Sri Lankans | 59.8 /100 | #164 | Average $44,014 |
| Immigrants | Philippines | 59.4 /100 | #165 | Average $44,000 |
| Immigrants | Uruguay | 59.3 /100 | #166 | Average $43,997 |
| English | 58.9 /100 | #167 | Average $43,982 |
| Belgians | 58.1 /100 | #168 | Average $43,951 |
Demographics Similar to Immigrants from Lithuania by Per Capita Income
In terms of per capita income, the demographic groups most similar to Immigrants from Lithuania are Immigrants from Turkey ($51,368, a difference of 0.010%), Immigrants from South Africa ($51,465, a difference of 0.20%), Immigrants from Korea ($51,671, a difference of 0.60%), Cambodian ($51,731, a difference of 0.72%), and Immigrants from Czechoslovakia ($51,770, a difference of 0.80%).
| Demographics | Rating | Rank | Per Capita Income |
| Immigrants | Greece | 100.0 /100 | #36 | Exceptional $51,891 |
| Estonians | 100.0 /100 | #37 | Exceptional $51,875 |
| Immigrants | Czechoslovakia | 100.0 /100 | #38 | Exceptional $51,770 |
| Cambodians | 100.0 /100 | #39 | Exceptional $51,731 |
| Immigrants | Korea | 100.0 /100 | #40 | Exceptional $51,671 |
| Immigrants | South Africa | 100.0 /100 | #41 | Exceptional $51,465 |
| Immigrants | Turkey | 100.0 /100 | #42 | Exceptional $51,368 |
| Immigrants | Lithuania | 100.0 /100 | #43 | Exceptional $51,361 |
| Immigrants | Europe | 100.0 /100 | #44 | Exceptional $50,950 |
| Immigrants | Spain | 100.0 /100 | #45 | Exceptional $50,933 |
| Immigrants | Latvia | 100.0 /100 | #46 | Exceptional $50,914 |
| Bulgarians | 100.0 /100 | #47 | Exceptional $50,906 |
| Immigrants | Serbia | 100.0 /100 | #48 | Exceptional $50,810 |
| New Zealanders | 100.0 /100 | #49 | Exceptional $50,575 |
| Immigrants | Sri Lanka | 100.0 /100 | #50 | Exceptional $50,555 |