Italian vs Tongan Median Male Earnings
COMPARE
Italian
Tongan
Median Male Earnings
Median Male Earnings Comparison
Italians
Tongans
$59,551
MEDIAN MALE EARNINGS
99.3/ 100
METRIC RATING
85th/ 347
METRIC RANK
$53,218
MEDIAN MALE EARNINGS
22.3/ 100
METRIC RATING
199th/ 347
METRIC RANK
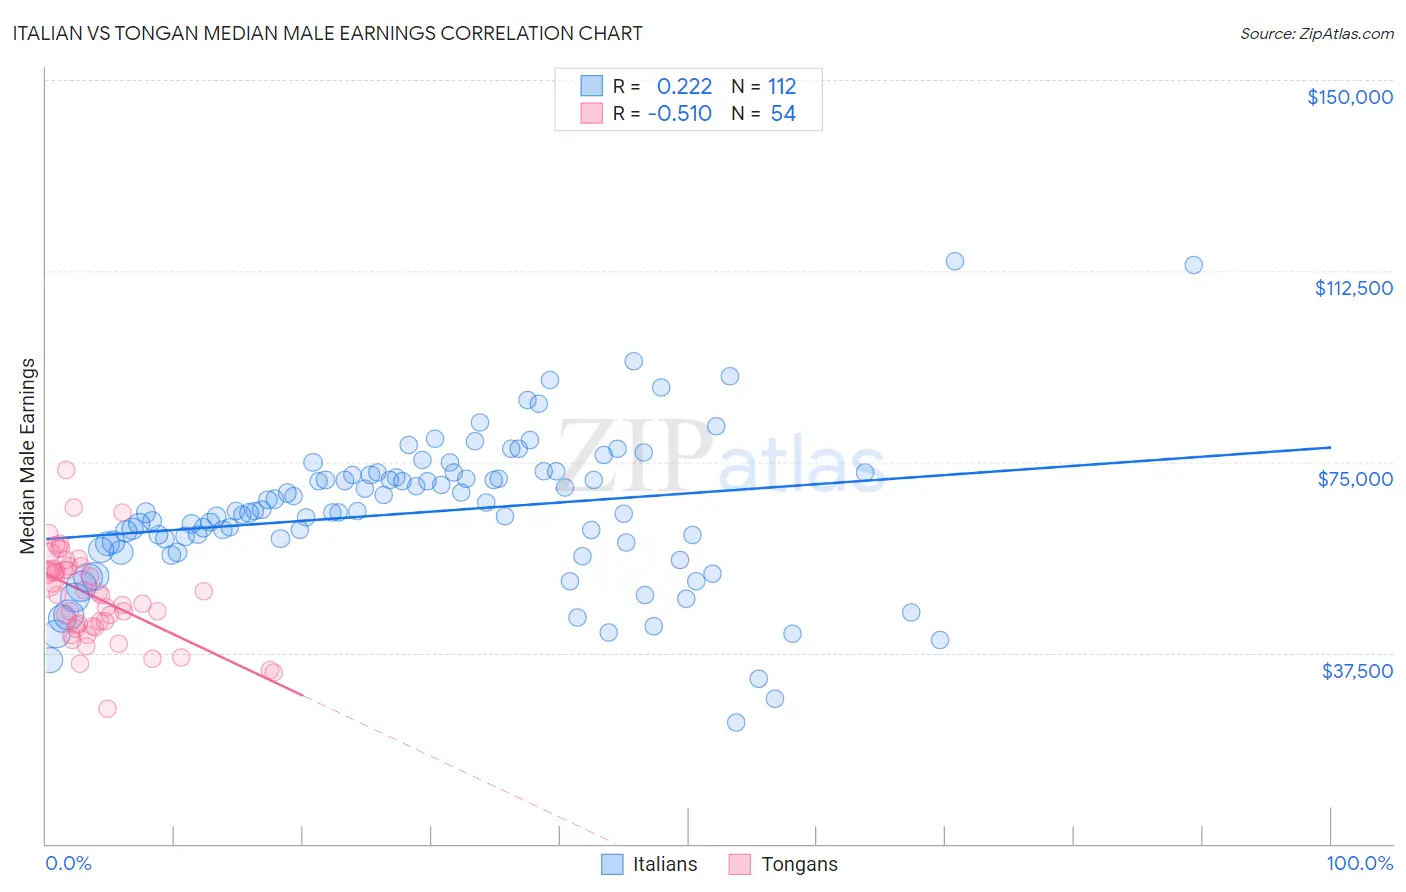
Italian vs Tongan Median Male Earnings Correlation Chart
The statistical analysis conducted on geographies consisting of 573,649,793 people shows a weak positive correlation between the proportion of Italians and median male earnings in the United States with a correlation coefficient (R) of 0.222 and weighted average of $59,551. Similarly, the statistical analysis conducted on geographies consisting of 102,813,527 people shows a substantial negative correlation between the proportion of Tongans and median male earnings in the United States with a correlation coefficient (R) of -0.510 and weighted average of $53,218, a difference of 11.9%.
Median Male Earnings Correlation Summary
| Measurement | Italian | Tongan |
| Minimum | $23,704 | $26,442 |
| Maximum | $114,356 | $73,315 |
| Range | $90,652 | $46,873 |
| Mean | $65,064 | $48,593 |
| Median | $65,149 | $48,873 |
| Interquartile 25% (IQ1) | $58,270 | $42,778 |
| Interquartile 75% (IQ3) | $72,487 | $54,132 |
| Interquartile Range (IQR) | $14,217 | $11,354 |
| Standard Deviation (Sample) | $14,744 | $8,947 |
| Standard Deviation (Population) | $14,679 | $8,864 |
Similar Demographics by Median Male Earnings
Demographics Similar to Italians by Median Male Earnings
In terms of median male earnings, the demographic groups most similar to Italians are Afghan ($59,554, a difference of 0.0%), Immigrants from England ($59,527, a difference of 0.040%), Macedonian ($59,522, a difference of 0.050%), Immigrants from Argentina ($59,491, a difference of 0.10%), and Immigrants from Moldova ($59,417, a difference of 0.23%).
| Demographics | Rating | Rank | Median Male Earnings |
| Immigrants | Egypt | 99.5 /100 | #78 | Exceptional $59,925 |
| Immigrants | Ukraine | 99.5 /100 | #79 | Exceptional $59,820 |
| Immigrants | Hungary | 99.5 /100 | #80 | Exceptional $59,806 |
| Ukrainians | 99.4 /100 | #81 | Exceptional $59,728 |
| Croatians | 99.4 /100 | #82 | Exceptional $59,715 |
| Immigrants | Italy | 99.4 /100 | #83 | Exceptional $59,691 |
| Afghans | 99.3 /100 | #84 | Exceptional $59,554 |
| Italians | 99.3 /100 | #85 | Exceptional $59,551 |
| Immigrants | England | 99.3 /100 | #86 | Exceptional $59,527 |
| Macedonians | 99.3 /100 | #87 | Exceptional $59,522 |
| Immigrants | Argentina | 99.3 /100 | #88 | Exceptional $59,491 |
| Immigrants | Moldova | 99.2 /100 | #89 | Exceptional $59,417 |
| Austrians | 99.2 /100 | #90 | Exceptional $59,359 |
| Laotians | 99.2 /100 | #91 | Exceptional $59,351 |
| Immigrants | Kazakhstan | 99.1 /100 | #92 | Exceptional $59,278 |
Demographics Similar to Tongans by Median Male Earnings
In terms of median male earnings, the demographic groups most similar to Tongans are Immigrants from Costa Rica ($53,237, a difference of 0.030%), Immigrants from Kenya ($53,427, a difference of 0.39%), Immigrants from Africa ($53,457, a difference of 0.45%), Immigrants from the Azores ($53,503, a difference of 0.53%), and Immigrants from Thailand ($52,908, a difference of 0.59%).
| Demographics | Rating | Rank | Median Male Earnings |
| Scotch-Irish | 30.6 /100 | #192 | Fair $53,658 |
| Kenyans | 30.4 /100 | #193 | Fair $53,647 |
| Spanish | 29.0 /100 | #194 | Fair $53,576 |
| Immigrants | Azores | 27.5 /100 | #195 | Fair $53,503 |
| Immigrants | Africa | 26.6 /100 | #196 | Fair $53,457 |
| Immigrants | Kenya | 26.0 /100 | #197 | Fair $53,427 |
| Immigrants | Costa Rica | 22.6 /100 | #198 | Fair $53,237 |
| Tongans | 22.3 /100 | #199 | Fair $53,218 |
| Immigrants | Thailand | 17.5 /100 | #200 | Poor $52,908 |
| Immigrants | Bosnia and Herzegovina | 16.9 /100 | #201 | Poor $52,869 |
| Immigrants | Uruguay | 16.8 /100 | #202 | Poor $52,860 |
| Panamanians | 16.5 /100 | #203 | Poor $52,835 |
| Ghanaians | 16.1 /100 | #204 | Poor $52,810 |
| Immigrants | Colombia | 15.0 /100 | #205 | Poor $52,725 |
| Immigrants | Iraq | 14.5 /100 | #206 | Poor $52,681 |