Italian vs Laotian Median Male Earnings
COMPARE
Italian
Laotian
Median Male Earnings
Median Male Earnings Comparison
Italians
Laotians
$59,551
MEDIAN MALE EARNINGS
99.3/ 100
METRIC RATING
85th/ 347
METRIC RANK
$59,351
MEDIAN MALE EARNINGS
99.2/ 100
METRIC RATING
91st/ 347
METRIC RANK
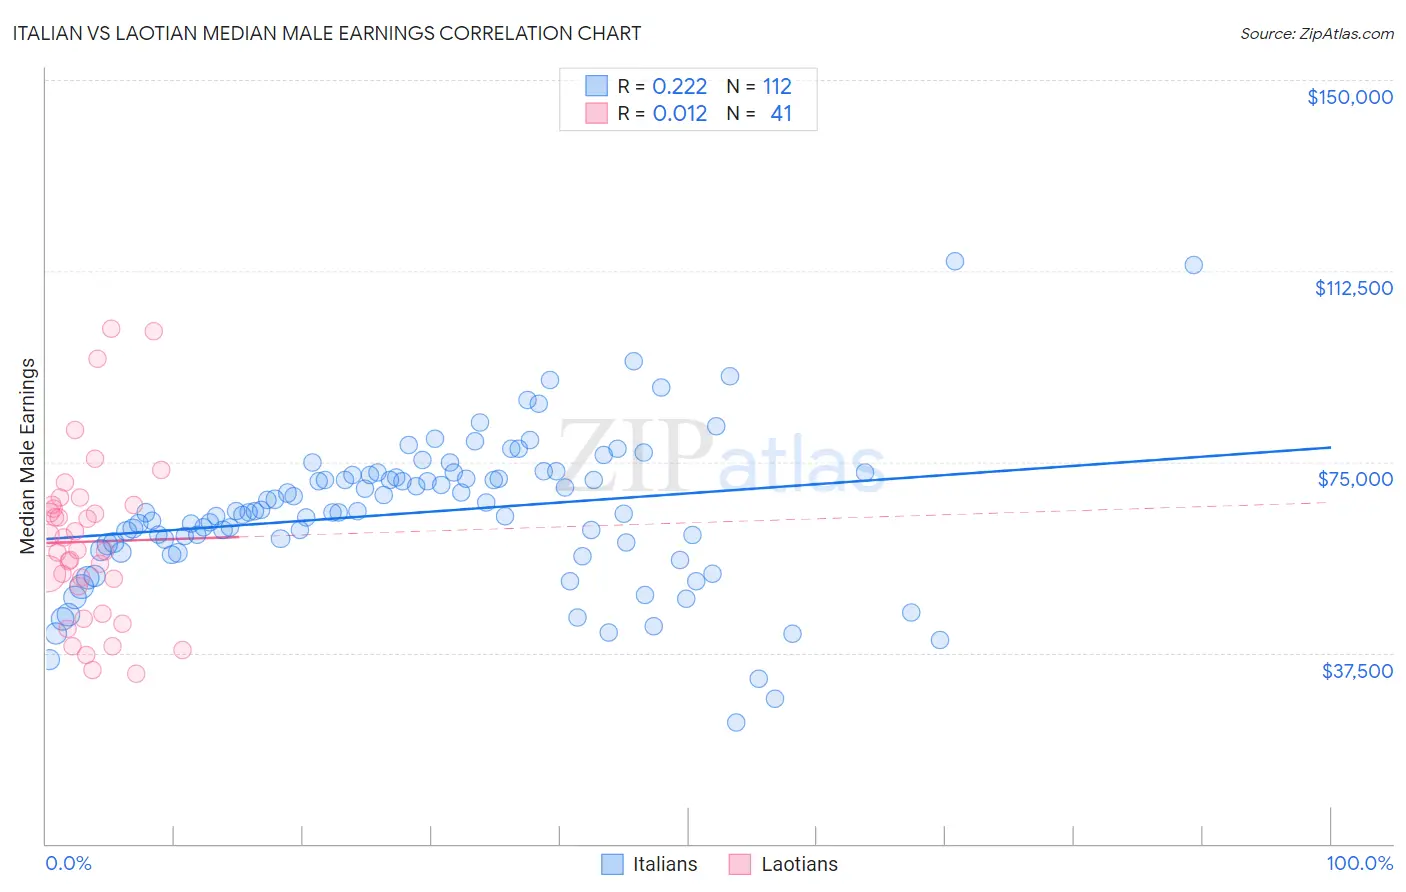
Italian vs Laotian Median Male Earnings Correlation Chart
The statistical analysis conducted on geographies consisting of 573,649,793 people shows a weak positive correlation between the proportion of Italians and median male earnings in the United States with a correlation coefficient (R) of 0.222 and weighted average of $59,551. Similarly, the statistical analysis conducted on geographies consisting of 224,845,741 people shows no correlation between the proportion of Laotians and median male earnings in the United States with a correlation coefficient (R) of 0.012 and weighted average of $59,351, a difference of 0.34%.
Median Male Earnings Correlation Summary
| Measurement | Italian | Laotian |
| Minimum | $23,704 | $33,481 |
| Maximum | $114,356 | $101,250 |
| Range | $90,652 | $67,769 |
| Mean | $65,064 | $59,314 |
| Median | $65,149 | $57,776 |
| Interquartile 25% (IQ1) | $58,270 | $47,781 |
| Interquartile 75% (IQ3) | $72,487 | $66,498 |
| Interquartile Range (IQR) | $14,217 | $18,717 |
| Standard Deviation (Sample) | $14,744 | $16,323 |
| Standard Deviation (Population) | $14,679 | $16,122 |
Demographics Similar to Italians and Laotians by Median Male Earnings
In terms of median male earnings, the demographic groups most similar to Italians are Afghan ($59,554, a difference of 0.0%), Immigrants from England ($59,527, a difference of 0.040%), Macedonian ($59,522, a difference of 0.050%), Immigrants from Argentina ($59,491, a difference of 0.10%), and Immigrants from Moldova ($59,417, a difference of 0.23%). Similarly, the demographic groups most similar to Laotians are Austrian ($59,359, a difference of 0.010%), Immigrants from Moldova ($59,417, a difference of 0.11%), Immigrants from Kazakhstan ($59,278, a difference of 0.12%), Immigrants from Southern Europe ($59,217, a difference of 0.23%), and Immigrants from Argentina ($59,491, a difference of 0.24%).
| Demographics | Rating | Rank | Median Male Earnings |
| Immigrants | Egypt | 99.5 /100 | #78 | Exceptional $59,925 |
| Immigrants | Ukraine | 99.5 /100 | #79 | Exceptional $59,820 |
| Immigrants | Hungary | 99.5 /100 | #80 | Exceptional $59,806 |
| Ukrainians | 99.4 /100 | #81 | Exceptional $59,728 |
| Croatians | 99.4 /100 | #82 | Exceptional $59,715 |
| Immigrants | Italy | 99.4 /100 | #83 | Exceptional $59,691 |
| Afghans | 99.3 /100 | #84 | Exceptional $59,554 |
| Italians | 99.3 /100 | #85 | Exceptional $59,551 |
| Immigrants | England | 99.3 /100 | #86 | Exceptional $59,527 |
| Macedonians | 99.3 /100 | #87 | Exceptional $59,522 |
| Immigrants | Argentina | 99.3 /100 | #88 | Exceptional $59,491 |
| Immigrants | Moldova | 99.2 /100 | #89 | Exceptional $59,417 |
| Austrians | 99.2 /100 | #90 | Exceptional $59,359 |
| Laotians | 99.2 /100 | #91 | Exceptional $59,351 |
| Immigrants | Kazakhstan | 99.1 /100 | #92 | Exceptional $59,278 |
| Immigrants | Southern Europe | 99.0 /100 | #93 | Exceptional $59,217 |
| Immigrants | North Macedonia | 99.0 /100 | #94 | Exceptional $59,189 |
| Immigrants | Lebanon | 98.6 /100 | #95 | Exceptional $58,835 |
| Albanians | 98.4 /100 | #96 | Exceptional $58,680 |
| Northern Europeans | 98.2 /100 | #97 | Exceptional $58,588 |
| Jordanians | 98.1 /100 | #98 | Exceptional $58,500 |