Italian vs Slavic Median Male Earnings
COMPARE
Italian
Slavic
Median Male Earnings
Median Male Earnings Comparison
Italians
Slavs
$59,551
MEDIAN MALE EARNINGS
99.3/ 100
METRIC RATING
85th/ 347
METRIC RANK
$56,390
MEDIAN MALE EARNINGS
86.5/ 100
METRIC RATING
137th/ 347
METRIC RANK
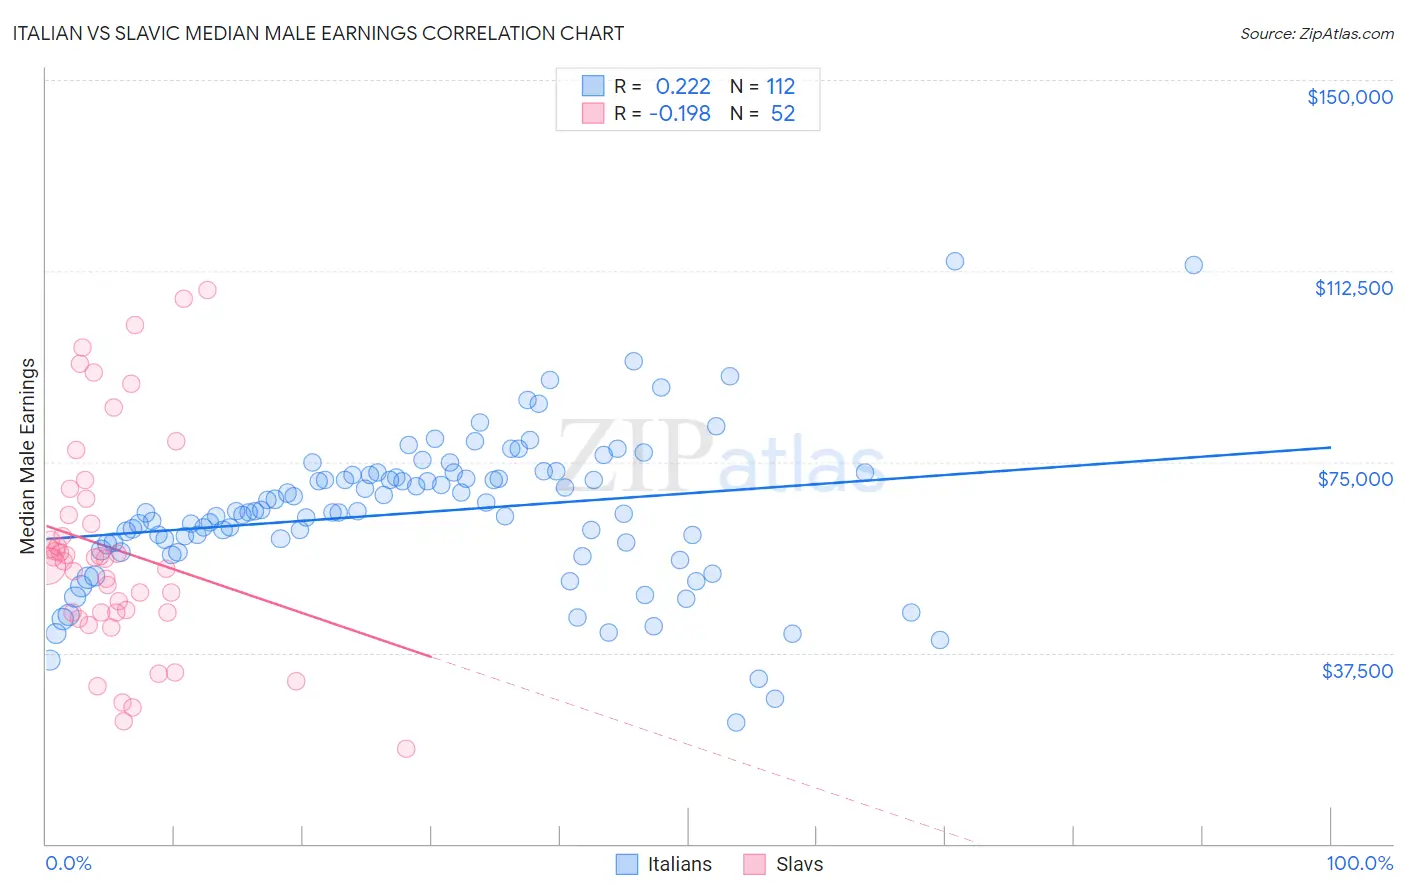
Italian vs Slavic Median Male Earnings Correlation Chart
The statistical analysis conducted on geographies consisting of 573,649,793 people shows a weak positive correlation between the proportion of Italians and median male earnings in the United States with a correlation coefficient (R) of 0.222 and weighted average of $59,551. Similarly, the statistical analysis conducted on geographies consisting of 270,818,256 people shows a poor negative correlation between the proportion of Slavs and median male earnings in the United States with a correlation coefficient (R) of -0.198 and weighted average of $56,390, a difference of 5.6%.
Median Male Earnings Correlation Summary
| Measurement | Italian | Slavic |
| Minimum | $23,704 | $18,676 |
| Maximum | $114,356 | $108,806 |
| Range | $90,652 | $90,130 |
| Mean | $65,064 | $57,922 |
| Median | $65,149 | $56,132 |
| Interquartile 25% (IQ1) | $58,270 | $45,442 |
| Interquartile 75% (IQ3) | $72,487 | $66,210 |
| Interquartile Range (IQR) | $14,217 | $20,768 |
| Standard Deviation (Sample) | $14,744 | $21,311 |
| Standard Deviation (Population) | $14,679 | $21,105 |
Similar Demographics by Median Male Earnings
Demographics Similar to Italians by Median Male Earnings
In terms of median male earnings, the demographic groups most similar to Italians are Afghan ($59,554, a difference of 0.0%), Immigrants from England ($59,527, a difference of 0.040%), Macedonian ($59,522, a difference of 0.050%), Immigrants from Argentina ($59,491, a difference of 0.10%), and Immigrants from Moldova ($59,417, a difference of 0.23%).
| Demographics | Rating | Rank | Median Male Earnings |
| Immigrants | Egypt | 99.5 /100 | #78 | Exceptional $59,925 |
| Immigrants | Ukraine | 99.5 /100 | #79 | Exceptional $59,820 |
| Immigrants | Hungary | 99.5 /100 | #80 | Exceptional $59,806 |
| Ukrainians | 99.4 /100 | #81 | Exceptional $59,728 |
| Croatians | 99.4 /100 | #82 | Exceptional $59,715 |
| Immigrants | Italy | 99.4 /100 | #83 | Exceptional $59,691 |
| Afghans | 99.3 /100 | #84 | Exceptional $59,554 |
| Italians | 99.3 /100 | #85 | Exceptional $59,551 |
| Immigrants | England | 99.3 /100 | #86 | Exceptional $59,527 |
| Macedonians | 99.3 /100 | #87 | Exceptional $59,522 |
| Immigrants | Argentina | 99.3 /100 | #88 | Exceptional $59,491 |
| Immigrants | Moldova | 99.2 /100 | #89 | Exceptional $59,417 |
| Austrians | 99.2 /100 | #90 | Exceptional $59,359 |
| Laotians | 99.2 /100 | #91 | Exceptional $59,351 |
| Immigrants | Kazakhstan | 99.1 /100 | #92 | Exceptional $59,278 |
Demographics Similar to Slavs by Median Male Earnings
In terms of median male earnings, the demographic groups most similar to Slavs are Immigrants from Saudi Arabia ($56,452, a difference of 0.11%), Irish ($56,464, a difference of 0.13%), Slovak ($56,306, a difference of 0.15%), Zimbabwean ($56,302, a difference of 0.16%), and Luxembourger ($56,300, a difference of 0.16%).
| Demographics | Rating | Rank | Median Male Earnings |
| Koreans | 89.4 /100 | #130 | Excellent $56,672 |
| Portuguese | 89.4 /100 | #131 | Excellent $56,663 |
| Czechs | 88.2 /100 | #132 | Excellent $56,546 |
| Immigrants | Germany | 88.2 /100 | #133 | Excellent $56,542 |
| Moroccans | 87.7 /100 | #134 | Excellent $56,499 |
| Irish | 87.4 /100 | #135 | Excellent $56,464 |
| Immigrants | Saudi Arabia | 87.2 /100 | #136 | Excellent $56,452 |
| Slavs | 86.5 /100 | #137 | Excellent $56,390 |
| Slovaks | 85.5 /100 | #138 | Excellent $56,306 |
| Zimbabweans | 85.5 /100 | #139 | Excellent $56,302 |
| Luxembourgers | 85.5 /100 | #140 | Excellent $56,300 |
| Danes | 84.8 /100 | #141 | Excellent $56,246 |
| Ethiopians | 84.8 /100 | #142 | Excellent $56,243 |
| Sri Lankans | 83.4 /100 | #143 | Excellent $56,136 |
| Immigrants | Uganda | 82.4 /100 | #144 | Excellent $56,064 |