Estonian vs Tongan Median Male Earnings
COMPARE
Estonian
Tongan
Median Male Earnings
Median Male Earnings Comparison
Estonians
Tongans
$61,710
MEDIAN MALE EARNINGS
99.9/ 100
METRIC RATING
51st/ 347
METRIC RANK
$53,218
MEDIAN MALE EARNINGS
22.3/ 100
METRIC RATING
199th/ 347
METRIC RANK
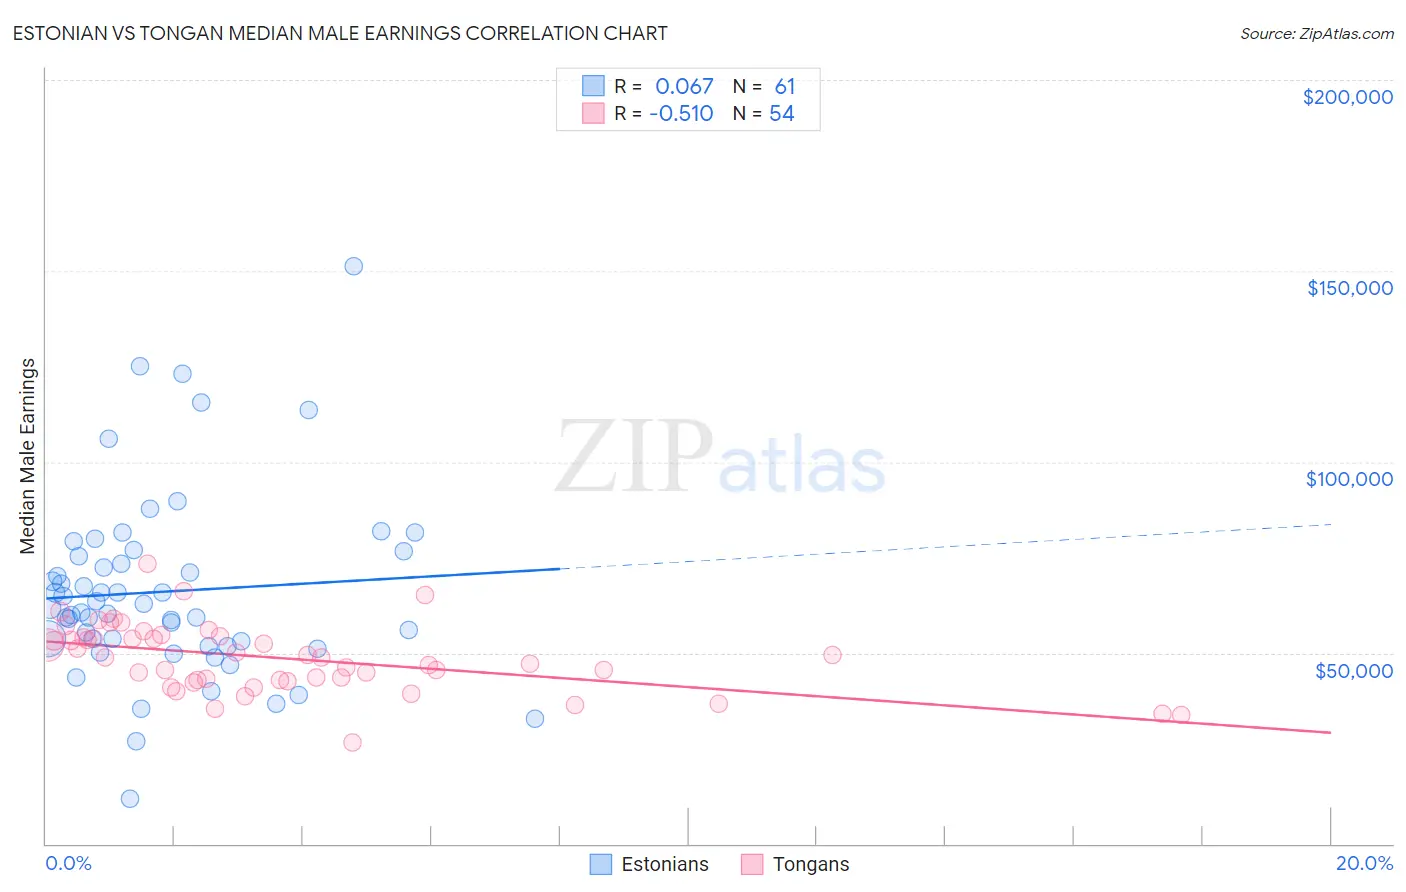
Estonian vs Tongan Median Male Earnings Correlation Chart
The statistical analysis conducted on geographies consisting of 123,512,238 people shows a slight positive correlation between the proportion of Estonians and median male earnings in the United States with a correlation coefficient (R) of 0.067 and weighted average of $61,710. Similarly, the statistical analysis conducted on geographies consisting of 102,813,527 people shows a substantial negative correlation between the proportion of Tongans and median male earnings in the United States with a correlation coefficient (R) of -0.510 and weighted average of $53,218, a difference of 16.0%.
Median Male Earnings Correlation Summary
| Measurement | Estonian | Tongan |
| Minimum | $11,700 | $26,442 |
| Maximum | $151,311 | $73,315 |
| Range | $139,611 | $46,873 |
| Mean | $66,018 | $48,593 |
| Median | $61,673 | $48,873 |
| Interquartile 25% (IQ1) | $52,472 | $42,778 |
| Interquartile 75% (IQ3) | $76,012 | $54,132 |
| Interquartile Range (IQR) | $23,541 | $11,354 |
| Standard Deviation (Sample) | $24,287 | $8,947 |
| Standard Deviation (Population) | $24,087 | $8,864 |
Similar Demographics by Median Male Earnings
Demographics Similar to Estonians by Median Male Earnings
In terms of median male earnings, the demographic groups most similar to Estonians are Bhutanese ($61,759, a difference of 0.080%), Immigrants from Norway ($61,628, a difference of 0.13%), South African ($61,460, a difference of 0.41%), Immigrants from Latvia ($61,422, a difference of 0.47%), and Immigrants from Europe ($62,057, a difference of 0.56%).
| Demographics | Rating | Rank | Median Male Earnings |
| Cambodians | 100.0 /100 | #44 | Exceptional $62,516 |
| Bulgarians | 100.0 /100 | #45 | Exceptional $62,378 |
| Immigrants | Czechoslovakia | 99.9 /100 | #46 | Exceptional $62,217 |
| Immigrants | Austria | 99.9 /100 | #47 | Exceptional $62,164 |
| Immigrants | Malaysia | 99.9 /100 | #48 | Exceptional $62,121 |
| Immigrants | Europe | 99.9 /100 | #49 | Exceptional $62,057 |
| Bhutanese | 99.9 /100 | #50 | Exceptional $61,759 |
| Estonians | 99.9 /100 | #51 | Exceptional $61,710 |
| Immigrants | Norway | 99.9 /100 | #52 | Exceptional $61,628 |
| South Africans | 99.9 /100 | #53 | Exceptional $61,460 |
| Immigrants | Latvia | 99.9 /100 | #54 | Exceptional $61,422 |
| Greeks | 99.9 /100 | #55 | Exceptional $61,242 |
| Lithuanians | 99.9 /100 | #56 | Exceptional $61,228 |
| Immigrants | Scotland | 99.9 /100 | #57 | Exceptional $61,220 |
| New Zealanders | 99.9 /100 | #58 | Exceptional $61,199 |
Demographics Similar to Tongans by Median Male Earnings
In terms of median male earnings, the demographic groups most similar to Tongans are Immigrants from Costa Rica ($53,237, a difference of 0.030%), Immigrants from Kenya ($53,427, a difference of 0.39%), Immigrants from Africa ($53,457, a difference of 0.45%), Immigrants from the Azores ($53,503, a difference of 0.53%), and Immigrants from Thailand ($52,908, a difference of 0.59%).
| Demographics | Rating | Rank | Median Male Earnings |
| Scotch-Irish | 30.6 /100 | #192 | Fair $53,658 |
| Kenyans | 30.4 /100 | #193 | Fair $53,647 |
| Spanish | 29.0 /100 | #194 | Fair $53,576 |
| Immigrants | Azores | 27.5 /100 | #195 | Fair $53,503 |
| Immigrants | Africa | 26.6 /100 | #196 | Fair $53,457 |
| Immigrants | Kenya | 26.0 /100 | #197 | Fair $53,427 |
| Immigrants | Costa Rica | 22.6 /100 | #198 | Fair $53,237 |
| Tongans | 22.3 /100 | #199 | Fair $53,218 |
| Immigrants | Thailand | 17.5 /100 | #200 | Poor $52,908 |
| Immigrants | Bosnia and Herzegovina | 16.9 /100 | #201 | Poor $52,869 |
| Immigrants | Uruguay | 16.8 /100 | #202 | Poor $52,860 |
| Panamanians | 16.5 /100 | #203 | Poor $52,835 |
| Ghanaians | 16.1 /100 | #204 | Poor $52,810 |
| Immigrants | Colombia | 15.0 /100 | #205 | Poor $52,725 |
| Immigrants | Iraq | 14.5 /100 | #206 | Poor $52,681 |