Italian vs Choctaw Median Male Earnings
COMPARE
Italian
Choctaw
Median Male Earnings
Median Male Earnings Comparison
Italians
Choctaw
$59,551
MEDIAN MALE EARNINGS
99.3/ 100
METRIC RATING
85th/ 347
METRIC RANK
$47,729
MEDIAN MALE EARNINGS
0.1/ 100
METRIC RATING
291st/ 347
METRIC RANK
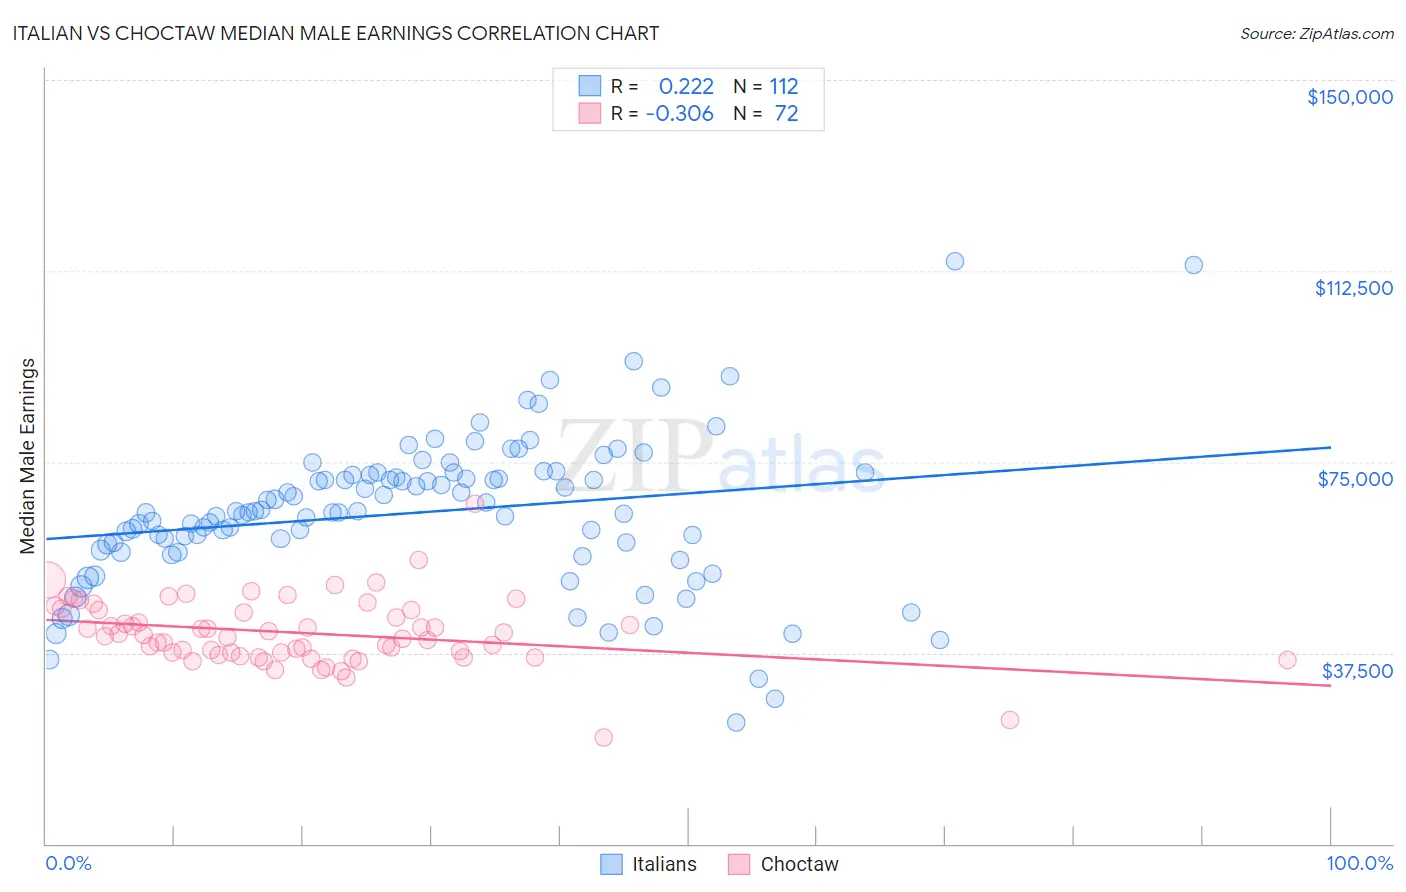
Italian vs Choctaw Median Male Earnings Correlation Chart
The statistical analysis conducted on geographies consisting of 573,649,793 people shows a weak positive correlation between the proportion of Italians and median male earnings in the United States with a correlation coefficient (R) of 0.222 and weighted average of $59,551. Similarly, the statistical analysis conducted on geographies consisting of 269,619,289 people shows a mild negative correlation between the proportion of Choctaw and median male earnings in the United States with a correlation coefficient (R) of -0.306 and weighted average of $47,729, a difference of 24.8%.
Median Male Earnings Correlation Summary
| Measurement | Italian | Choctaw |
| Minimum | $23,704 | $20,833 |
| Maximum | $114,356 | $66,862 |
| Range | $90,652 | $46,029 |
| Mean | $65,064 | $41,431 |
| Median | $65,149 | $40,848 |
| Interquartile 25% (IQ1) | $58,270 | $37,230 |
| Interquartile 75% (IQ3) | $72,487 | $45,935 |
| Interquartile Range (IQR) | $14,217 | $8,705 |
| Standard Deviation (Sample) | $14,744 | $6,709 |
| Standard Deviation (Population) | $14,679 | $6,663 |
Similar Demographics by Median Male Earnings
Demographics Similar to Italians by Median Male Earnings
In terms of median male earnings, the demographic groups most similar to Italians are Afghan ($59,554, a difference of 0.0%), Immigrants from England ($59,527, a difference of 0.040%), Macedonian ($59,522, a difference of 0.050%), Immigrants from Argentina ($59,491, a difference of 0.10%), and Immigrants from Moldova ($59,417, a difference of 0.23%).
| Demographics | Rating | Rank | Median Male Earnings |
| Immigrants | Egypt | 99.5 /100 | #78 | Exceptional $59,925 |
| Immigrants | Ukraine | 99.5 /100 | #79 | Exceptional $59,820 |
| Immigrants | Hungary | 99.5 /100 | #80 | Exceptional $59,806 |
| Ukrainians | 99.4 /100 | #81 | Exceptional $59,728 |
| Croatians | 99.4 /100 | #82 | Exceptional $59,715 |
| Immigrants | Italy | 99.4 /100 | #83 | Exceptional $59,691 |
| Afghans | 99.3 /100 | #84 | Exceptional $59,554 |
| Italians | 99.3 /100 | #85 | Exceptional $59,551 |
| Immigrants | England | 99.3 /100 | #86 | Exceptional $59,527 |
| Macedonians | 99.3 /100 | #87 | Exceptional $59,522 |
| Immigrants | Argentina | 99.3 /100 | #88 | Exceptional $59,491 |
| Immigrants | Moldova | 99.2 /100 | #89 | Exceptional $59,417 |
| Austrians | 99.2 /100 | #90 | Exceptional $59,359 |
| Laotians | 99.2 /100 | #91 | Exceptional $59,351 |
| Immigrants | Kazakhstan | 99.1 /100 | #92 | Exceptional $59,278 |
Demographics Similar to Choctaw by Median Male Earnings
In terms of median male earnings, the demographic groups most similar to Choctaw are Immigrants from Dominica ($47,651, a difference of 0.16%), Immigrants from Belize ($47,809, a difference of 0.17%), Chickasaw ($47,832, a difference of 0.22%), Shoshone ($47,930, a difference of 0.42%), and Indonesian ($47,503, a difference of 0.48%).
| Demographics | Rating | Rank | Median Male Earnings |
| Africans | 0.2 /100 | #284 | Tragic $47,994 |
| Paiute | 0.2 /100 | #285 | Tragic $47,991 |
| Mexican American Indians | 0.2 /100 | #286 | Tragic $47,990 |
| Immigrants | El Salvador | 0.2 /100 | #287 | Tragic $47,973 |
| Shoshone | 0.2 /100 | #288 | Tragic $47,930 |
| Chickasaw | 0.1 /100 | #289 | Tragic $47,832 |
| Immigrants | Belize | 0.1 /100 | #290 | Tragic $47,809 |
| Choctaw | 0.1 /100 | #291 | Tragic $47,729 |
| Immigrants | Dominica | 0.1 /100 | #292 | Tragic $47,651 |
| Indonesians | 0.1 /100 | #293 | Tragic $47,503 |
| Immigrants | Nicaragua | 0.1 /100 | #294 | Tragic $47,482 |
| Central American Indians | 0.1 /100 | #295 | Tragic $47,433 |
| Inupiat | 0.1 /100 | #296 | Tragic $47,281 |
| Dominicans | 0.1 /100 | #297 | Tragic $47,204 |
| Immigrants | Micronesia | 0.1 /100 | #298 | Tragic $47,177 |