Italian vs Basque Median Male Earnings
COMPARE
Italian
Basque
Median Male Earnings
Median Male Earnings Comparison
Italians
Basques
$59,551
MEDIAN MALE EARNINGS
99.3/ 100
METRIC RATING
85th/ 347
METRIC RANK
$55,370
MEDIAN MALE EARNINGS
70.3/ 100
METRIC RATING
160th/ 347
METRIC RANK
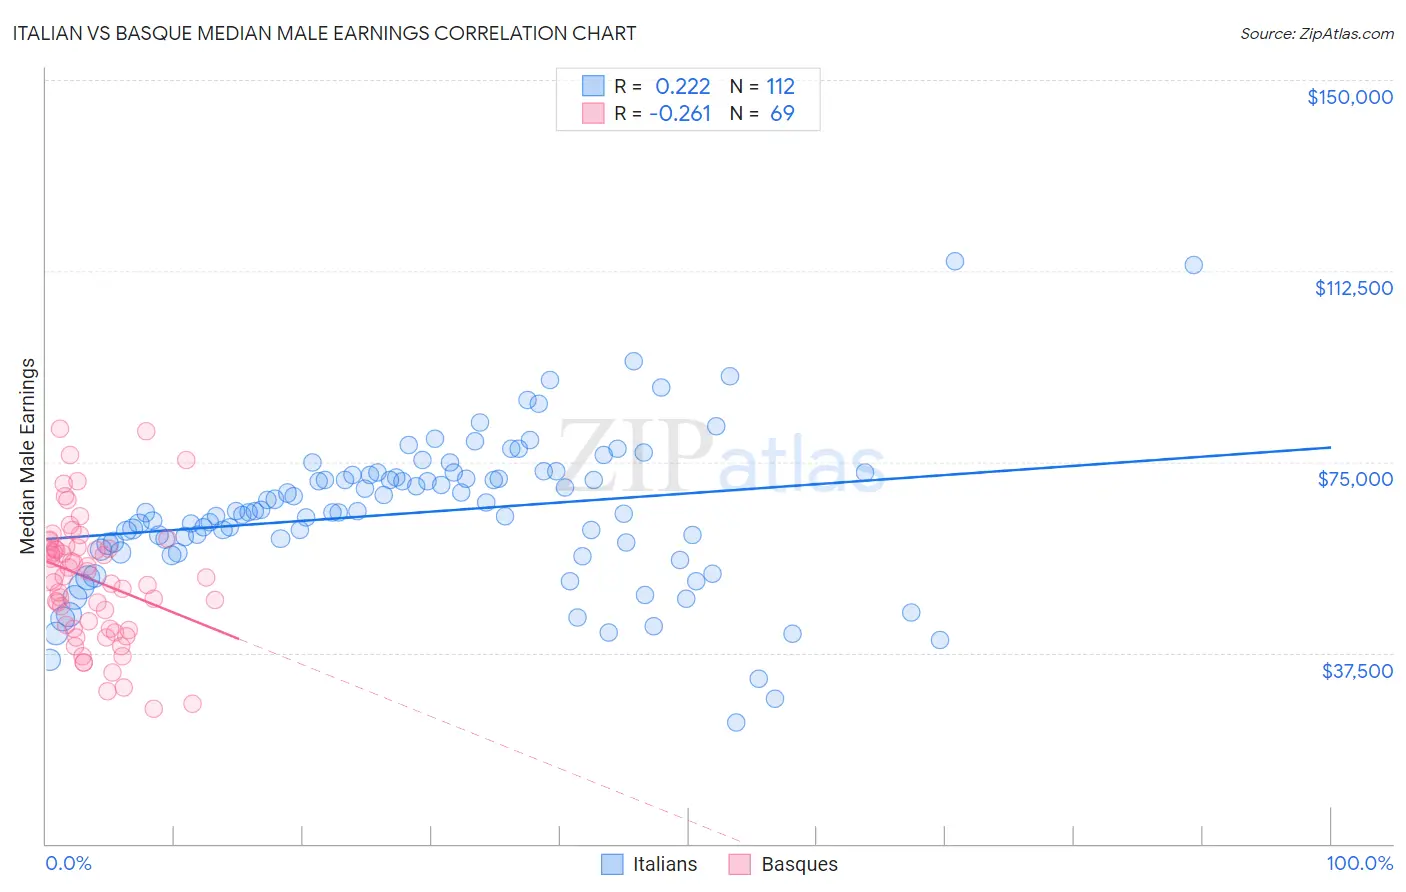
Italian vs Basque Median Male Earnings Correlation Chart
The statistical analysis conducted on geographies consisting of 573,649,793 people shows a weak positive correlation between the proportion of Italians and median male earnings in the United States with a correlation coefficient (R) of 0.222 and weighted average of $59,551. Similarly, the statistical analysis conducted on geographies consisting of 165,750,902 people shows a weak negative correlation between the proportion of Basques and median male earnings in the United States with a correlation coefficient (R) of -0.261 and weighted average of $55,370, a difference of 7.5%.
Median Male Earnings Correlation Summary
| Measurement | Italian | Basque |
| Minimum | $23,704 | $26,442 |
| Maximum | $114,356 | $81,428 |
| Range | $90,652 | $54,986 |
| Mean | $65,064 | $51,886 |
| Median | $65,149 | $52,492 |
| Interquartile 25% (IQ1) | $58,270 | $42,224 |
| Interquartile 75% (IQ3) | $72,487 | $58,280 |
| Interquartile Range (IQR) | $14,217 | $16,056 |
| Standard Deviation (Sample) | $14,744 | $12,223 |
| Standard Deviation (Population) | $14,679 | $12,134 |
Similar Demographics by Median Male Earnings
Demographics Similar to Italians by Median Male Earnings
In terms of median male earnings, the demographic groups most similar to Italians are Afghan ($59,554, a difference of 0.0%), Immigrants from England ($59,527, a difference of 0.040%), Macedonian ($59,522, a difference of 0.050%), Immigrants from Argentina ($59,491, a difference of 0.10%), and Immigrants from Moldova ($59,417, a difference of 0.23%).
| Demographics | Rating | Rank | Median Male Earnings |
| Immigrants | Egypt | 99.5 /100 | #78 | Exceptional $59,925 |
| Immigrants | Ukraine | 99.5 /100 | #79 | Exceptional $59,820 |
| Immigrants | Hungary | 99.5 /100 | #80 | Exceptional $59,806 |
| Ukrainians | 99.4 /100 | #81 | Exceptional $59,728 |
| Croatians | 99.4 /100 | #82 | Exceptional $59,715 |
| Immigrants | Italy | 99.4 /100 | #83 | Exceptional $59,691 |
| Afghans | 99.3 /100 | #84 | Exceptional $59,554 |
| Italians | 99.3 /100 | #85 | Exceptional $59,551 |
| Immigrants | England | 99.3 /100 | #86 | Exceptional $59,527 |
| Macedonians | 99.3 /100 | #87 | Exceptional $59,522 |
| Immigrants | Argentina | 99.3 /100 | #88 | Exceptional $59,491 |
| Immigrants | Moldova | 99.2 /100 | #89 | Exceptional $59,417 |
| Austrians | 99.2 /100 | #90 | Exceptional $59,359 |
| Laotians | 99.2 /100 | #91 | Exceptional $59,351 |
| Immigrants | Kazakhstan | 99.1 /100 | #92 | Exceptional $59,278 |
Demographics Similar to Basques by Median Male Earnings
In terms of median male earnings, the demographic groups most similar to Basques are Czechoslovakian ($55,382, a difference of 0.020%), Alsatian ($55,380, a difference of 0.020%), Belgian ($55,361, a difference of 0.020%), French ($55,350, a difference of 0.040%), and Icelander ($55,415, a difference of 0.080%).
| Demographics | Rating | Rank | Median Male Earnings |
| Immigrants | Nepal | 75.0 /100 | #153 | Good $55,615 |
| Taiwanese | 73.9 /100 | #154 | Good $55,556 |
| Scandinavians | 73.4 /100 | #155 | Good $55,527 |
| Immigrants | Ethiopia | 71.6 /100 | #156 | Good $55,434 |
| Icelanders | 71.2 /100 | #157 | Good $55,415 |
| Czechoslovakians | 70.5 /100 | #158 | Good $55,382 |
| Alsatians | 70.5 /100 | #159 | Good $55,380 |
| Basques | 70.3 /100 | #160 | Good $55,370 |
| Belgians | 70.1 /100 | #161 | Good $55,361 |
| French | 69.9 /100 | #162 | Good $55,350 |
| Ugandans | 68.6 /100 | #163 | Good $55,290 |
| Immigrants | South Eastern Asia | 67.6 /100 | #164 | Good $55,241 |
| Immigrants | Portugal | 66.3 /100 | #165 | Good $55,182 |
| Germans | 61.6 /100 | #166 | Good $54,974 |
| Immigrants | Fiji | 61.2 /100 | #167 | Good $54,958 |