Italian vs Immigrants from Canada Median Male Earnings
COMPARE
Italian
Immigrants from Canada
Median Male Earnings
Median Male Earnings Comparison
Italians
Immigrants from Canada
$59,551
MEDIAN MALE EARNINGS
99.3/ 100
METRIC RATING
85th/ 347
METRIC RANK
$60,388
MEDIAN MALE EARNINGS
99.7/ 100
METRIC RATING
69th/ 347
METRIC RANK
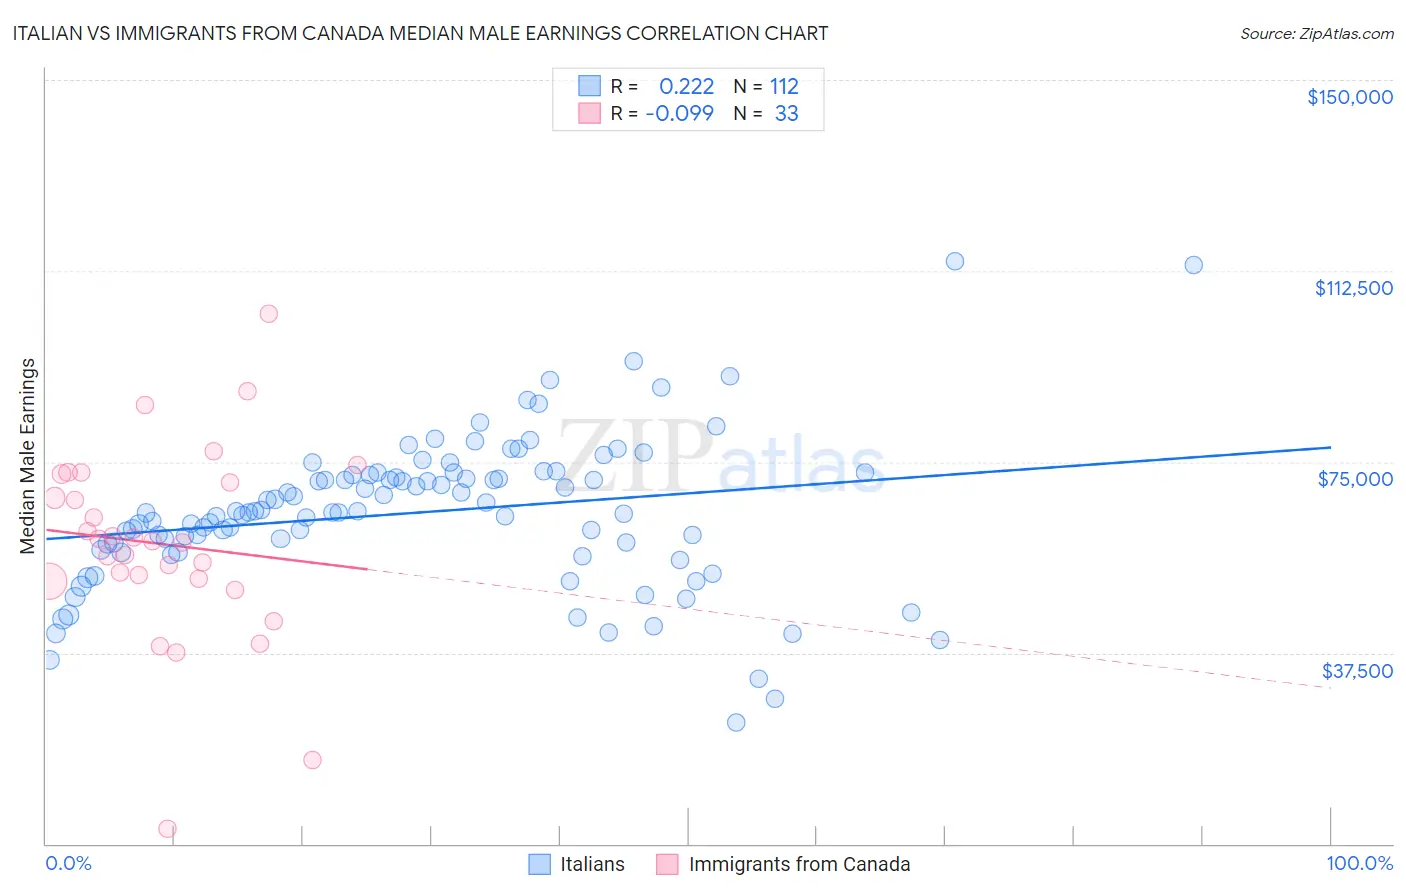
Italian vs Immigrants from Canada Median Male Earnings Correlation Chart
The statistical analysis conducted on geographies consisting of 573,649,793 people shows a weak positive correlation between the proportion of Italians and median male earnings in the United States with a correlation coefficient (R) of 0.222 and weighted average of $59,551. Similarly, the statistical analysis conducted on geographies consisting of 459,122,230 people shows a slight negative correlation between the proportion of Immigrants from Canada and median male earnings in the United States with a correlation coefficient (R) of -0.099 and weighted average of $60,388, a difference of 1.4%.
Median Male Earnings Correlation Summary
| Measurement | Italian | Immigrants from Canada |
| Minimum | $23,704 | $2,875 |
| Maximum | $114,356 | $104,091 |
| Range | $90,652 | $101,216 |
| Mean | $65,064 | $58,839 |
| Median | $65,149 | $59,365 |
| Interquartile 25% (IQ1) | $58,270 | $51,760 |
| Interquartile 75% (IQ3) | $72,487 | $71,783 |
| Interquartile Range (IQR) | $14,217 | $20,022 |
| Standard Deviation (Sample) | $14,744 | $19,265 |
| Standard Deviation (Population) | $14,679 | $18,971 |
Demographics Similar to Italians and Immigrants from Canada by Median Male Earnings
In terms of median male earnings, the demographic groups most similar to Italians are Afghan ($59,554, a difference of 0.0%), Immigrants from England ($59,527, a difference of 0.040%), Macedonian ($59,522, a difference of 0.050%), Immigrants from Italy ($59,691, a difference of 0.24%), and Croatian ($59,715, a difference of 0.27%). Similarly, the demographic groups most similar to Immigrants from Canada are Immigrants from Bulgaria ($60,358, a difference of 0.050%), Mongolian ($60,350, a difference of 0.060%), Immigrants from Western Europe ($60,334, a difference of 0.090%), Immigrants from North America ($60,265, a difference of 0.20%), and Immigrants from Serbia ($60,600, a difference of 0.35%).
| Demographics | Rating | Rank | Median Male Earnings |
| Immigrants | Spain | 99.8 /100 | #67 | Exceptional $60,750 |
| Immigrants | Serbia | 99.7 /100 | #68 | Exceptional $60,600 |
| Immigrants | Canada | 99.7 /100 | #69 | Exceptional $60,388 |
| Immigrants | Bulgaria | 99.7 /100 | #70 | Exceptional $60,358 |
| Mongolians | 99.7 /100 | #71 | Exceptional $60,350 |
| Immigrants | Western Europe | 99.7 /100 | #72 | Exceptional $60,334 |
| Immigrants | North America | 99.7 /100 | #73 | Exceptional $60,265 |
| Argentineans | 99.6 /100 | #74 | Exceptional $60,117 |
| Immigrants | Bolivia | 99.6 /100 | #75 | Exceptional $60,088 |
| Romanians | 99.6 /100 | #76 | Exceptional $60,063 |
| Paraguayans | 99.5 /100 | #77 | Exceptional $59,975 |
| Immigrants | Egypt | 99.5 /100 | #78 | Exceptional $59,925 |
| Immigrants | Ukraine | 99.5 /100 | #79 | Exceptional $59,820 |
| Immigrants | Hungary | 99.5 /100 | #80 | Exceptional $59,806 |
| Ukrainians | 99.4 /100 | #81 | Exceptional $59,728 |
| Croatians | 99.4 /100 | #82 | Exceptional $59,715 |
| Immigrants | Italy | 99.4 /100 | #83 | Exceptional $59,691 |
| Afghans | 99.3 /100 | #84 | Exceptional $59,554 |
| Italians | 99.3 /100 | #85 | Exceptional $59,551 |
| Immigrants | England | 99.3 /100 | #86 | Exceptional $59,527 |
| Macedonians | 99.3 /100 | #87 | Exceptional $59,522 |